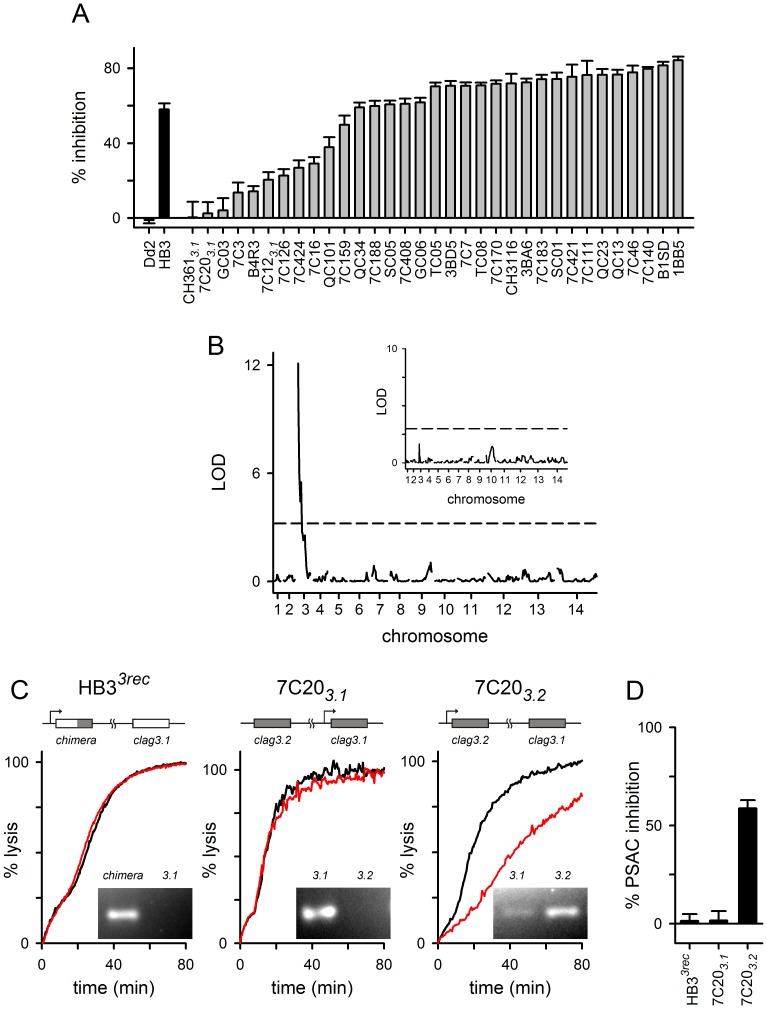
Figure 2. clag3 genes accounts for the differing sensitivities to chymotrypsin.
(A) Mean ± S.E.M. block of sorbitol uptake by chymotrypsin treatment on indicated parental lines and progeny clones (black and gray bars, respectively). (B) Logarithm of odds (LOD) scores from a primary scan of QTL associated with PSAC inhibition. The peak at the 5′ end of chromosome 3 contains the two clag3 genes. The P = 0.05 significance threshold (dashed horizontal line) was calculated from 1000 permutations. Inset shows results from a secondary scan for additional QTL after controlling for the clag3 locus. No other loci reached the P = 0.05 threshold (dashed horizontal line). (C) Osmotic lysis kinetics for indicated parasites after selection for expression of a specific clag3 gene. Black and red traces represent no protease control and chymotrypsin-treated cells, respectively. The ribbon schematic at the top of each panel shows the gene structure for the two clag3 genes in each parasite with active transcription indicated by a bent arrow. The clag3 gene resulting from allelic exchange in HB33rec has a gray shaded 3′ end to indicate the fragment derived from Dd2 (“chimera”). For each parasite, relative expression of the two paralogs is shown with an ethidium-stained gel at the bottom right of each panel. (D) Mean ± S.E.M. chymotrypsin-induced inhibition for each selected parasite.

