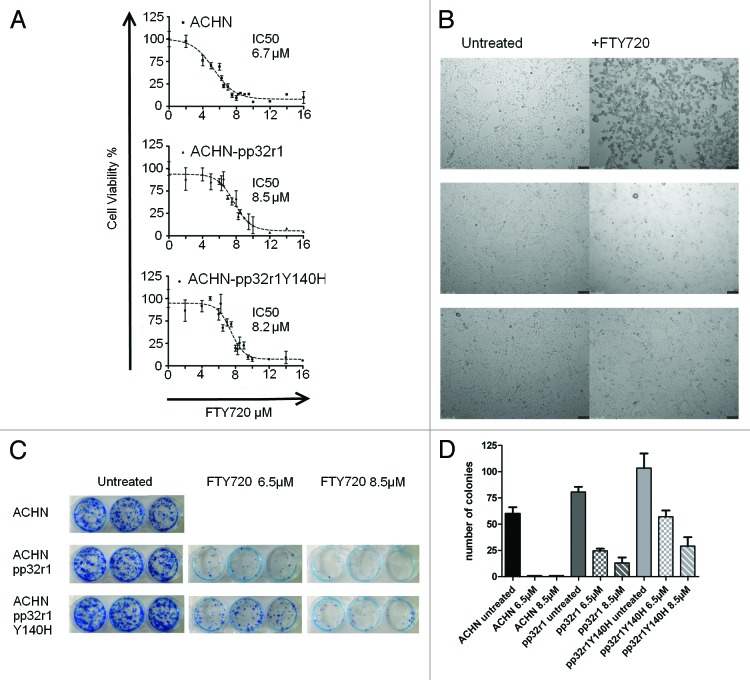
Figure 2. Increased viability of pp32r1 and pp32r1Y140H cell lines treated with FTY720. (A) MTT assay performed on ACHN, ACHN-pp32r1, and ACHN-pp32r1Y140H cell lines treated with 2–16 µM FTY720 and compared with untreated cells. (B) Cells were treated with 6.5 µM FTY720 and visualized by light microscopy. ACHN cells show significant onset of apoptosis while transduced cell lines illustrate only a few cells with apoptotic features. (C) Colony formation assay of untransduced and transduced cell lines treated with 6.5 and 8.5 µM FTY720. (D) A graphical representation of the data shown in (C).

An official website of the United States government
Here's how you know
Official websites use .gov
A
.gov website belongs to an official
government organization in the United States.
Secure .gov websites use HTTPS
A lock (
) or https:// means you've safely
connected to the .gov website. Share sensitive
information only on official, secure websites.
