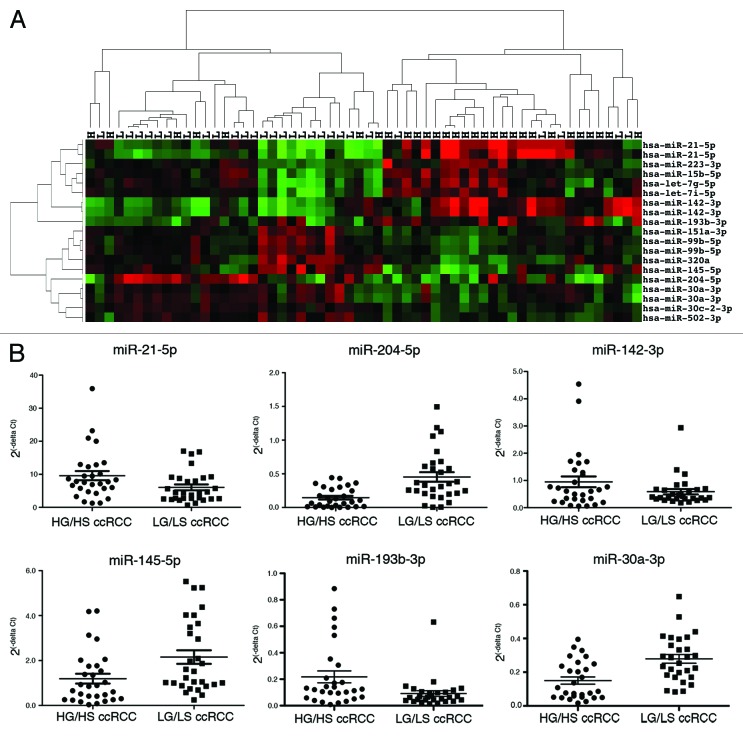
Figure 1. miRNA expression can distinguish early and advanced ccRCC. (A) Unsupervised two-dimensional hierarchical clustering of 58 ccRCC samples using a data matrix of the 19 probes with an FDR < 0.2 and P < 0.05 and >1.5-fold change of the level of expression between 29 LGLS and 29 HGHS ccRCC. Tumor samples are displayed on the horizontal axis and individual miRNAs on the vertical axis. Tumor samples are designated L for LGLS and H for HGHS. The dendrogram on the horizontal axis indicates the two highest level clusters of tumors. (B) Real-time RT-PCR was performed on all the 58 ccRCC samples run on the array to amplify the six most differentially expressed miRNAs indicated by microarray analysis. Relative quantification was achieved by plotting 2(−∆CT) values of all the early and advanced groups of samples.

An official website of the United States government
Here's how you know
Official websites use .gov
A
.gov website belongs to an official
government organization in the United States.
Secure .gov websites use HTTPS
A lock (
) or https:// means you've safely
connected to the .gov website. Share sensitive
information only on official, secure websites.
