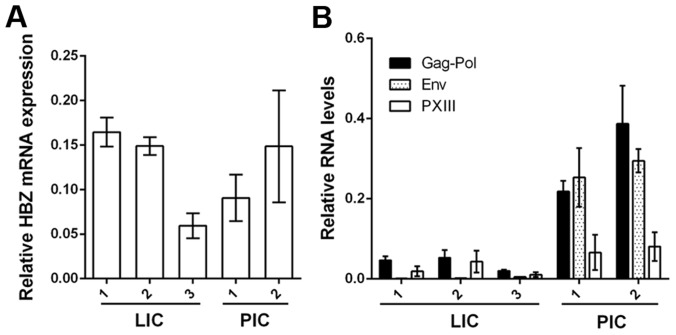
Figure 3. Expression of viral mRNA transcripts in LICs and PICs.
Total RNA was prepared from each cell line, and cDNA was synthesized using HBZ antisense primer (A) or a cDNA synthesis supermix (B) followed by real-time PCR using gene specific primers for HBZ (A) and Gag-Pol, Env and pX regions (B). The results were normalized to β-actin mRNA in the same sample. Relative mRNA expression is represented. Primer sequences are listed in Table S2.

