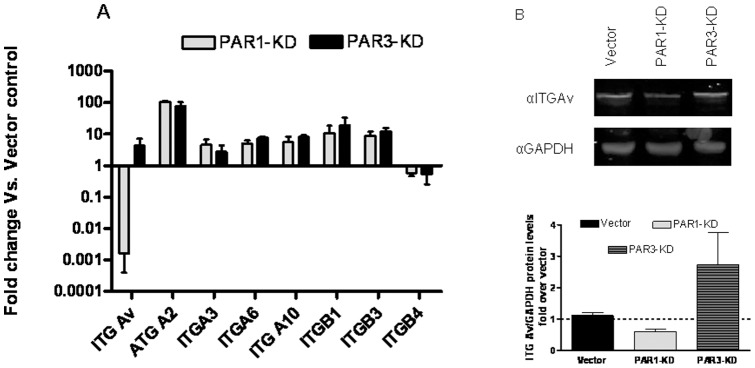
Figure 4. Integrins' mRNAs levels of vector-controls and PAR-1 or -3 KD cells.

A- Vector-control, PAR-1 or -3 KD cells were assayed for mRNA levels of the designated integrins and normalized to GAPDH mRNA levels. The results are presented as fold difference of respective KDs mRNA levels to those of vector-controls. The results represent mean±SE of at least 3 independent experiments. B-Representative western blot analysis of ITGαV and GAPDH in Vector-Control, PAR-1 or -3 KD cells. Lowe panel-quantification of protein expression from three different western blots with 3 different cell lysates for each sample. The results represent mean±SE of 3 independent experiments.
