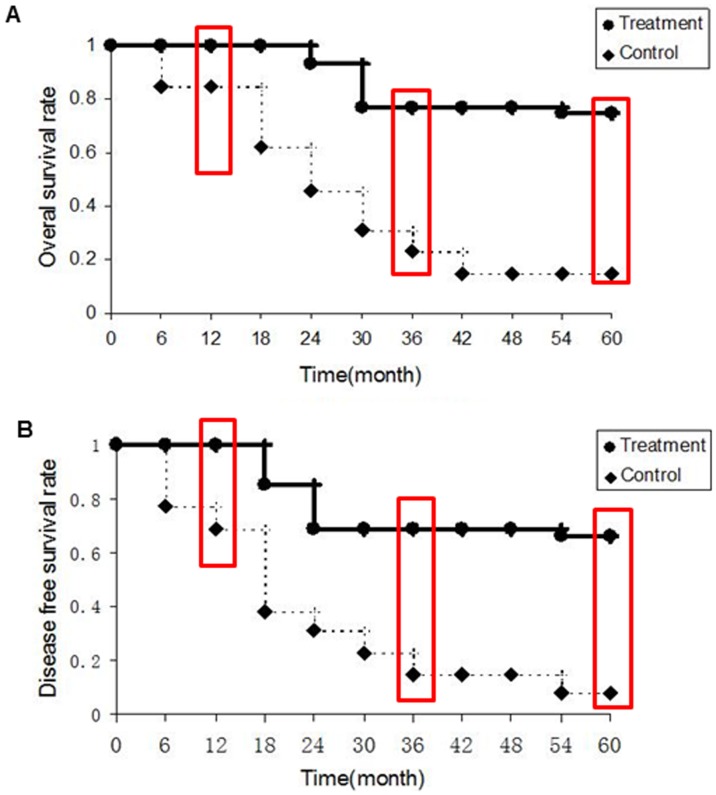
Figure 6.
(A) The overall survival rate of the colorectal cancer patients. The 1-, 3-, and 5-year survival rates in the treatment group were 100%, 77%, and 75%, compared with the control 85%, 23%, and 15% respectively. (B) Disease free survival of the gastric cancer patients. The 1-, 3-, and 5-year survival rates in the treatment group were 100%, 69%, and 66%, compared with the control 69%, 15%, and 8% respectively. The cumulative survival curves in A and B were analyzed by the Kaplan-Meier method.

