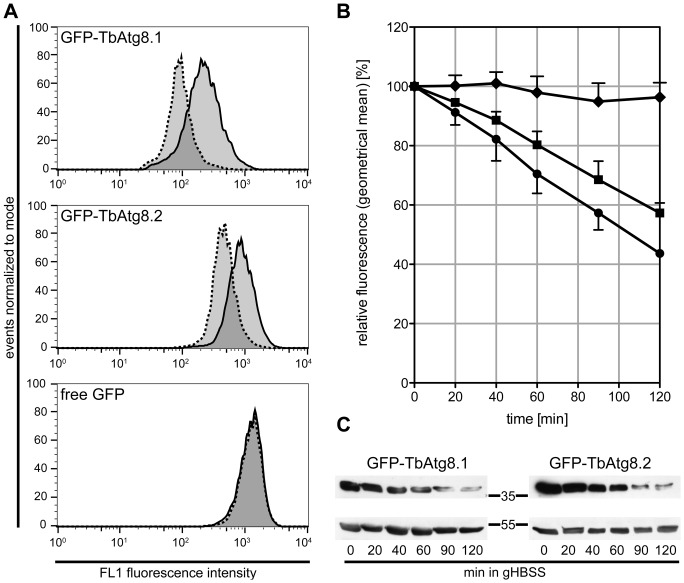
Figure 2. Decrease of GFP-TbAtg8 fluorescence during starvation.
T. brucei procyclic forms expressing GFP-TbAtg8.1, GFP-TbAtg8.2 or free GFP were starved in gHBSS and analyzed by flow cytometry (A, B) and SDS-PAGE/immunoblotting (C). (A) Flow cytometry of unstarved (solid) and starved (dashed) cells after 2 h of starvation; the lines show signals in the FL1 channel. (B) Geometrical means of GFP signals during starvation (for 0 and 2 h see A) relative to the intensity at time point 0 minutes. Symbols represent GFP-TbAtg8.1 (•), GFP-TbAtg8.2 (▪) and free GFP (♦). Error bars indicate standard deviations from three independent experiments. (C) Immunoblots of parasite lysates during starvation using antibodies against GFP (upper panels), or eukaryotic elongation factor 1A (lower panels) as loading control. For GFP-TbAtg8.1 (left panels), 3×10⁷ parasites were loaded per time point, for GFP-TbAtg8.2 (right panels), 5×10⁶ parasites were loaded. Molecular mass markers are indicated in kDa in the margin.

