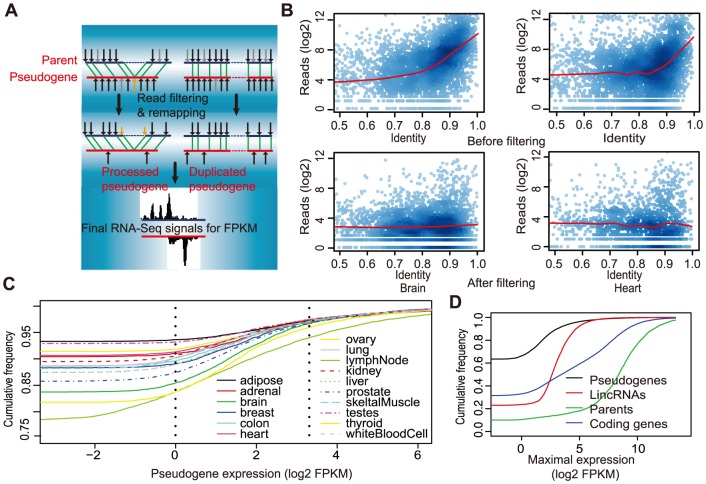
Figure 1. Identification of transcribed pseudogenes from RNA-Seq data.
A) A schematic illustration of the key concept of filtering out reads not-uniquely matched to pseudogenes. Black and gray arrows represent perfectly matched and mismatched RNA-Seq reads, respectively, and the matched locations were kept. Yellow arrows represent a read initially put on a processed pseudogene but mapped back to the parent, based on aligning reads to coding sequences, because it is from an exon-exon junction. Green lines denote identical short sequences shared between gene and pseudogene. The left and right cartoons represent processed and duplicated pseudogenes, respectively. The bottom plots final read coverage on a pseudogene (red) and its parent (black), indicating that RNA-Seq signals have largely been resolved. B) Filtering effectively reduces the correlation between the number of mapped reads and sequence identity of a pseudogene to its parental gene. The number of mapped reads (y-axis) within every 200-bp region of a pseudogene is plotted against this region's sequence identity (x-axis) to the parental gene. Representative data for two tissues (brain and heart) were shown (top, before filtering; bottom, after filtering). C) Distributions of transcription values (i.e., FPKMs) of pseudogenes in all 16 tissues (the two vertical dash lines mark 1 and 10 FPKM, respectively). D) Distributions of the maximal FPKMs for lincRNAs, pseudogenes, their parents, and the rest of coding genes.

