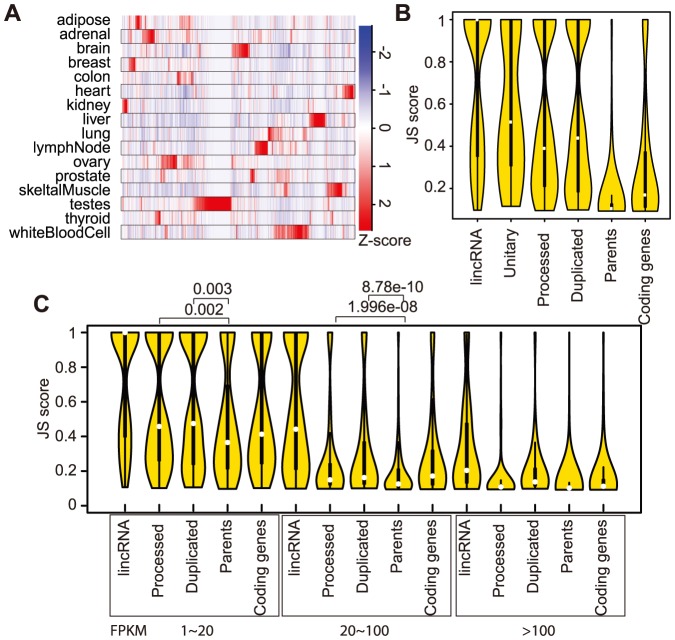
Figure 2. High tissue specificity of pseudogene transcription.
A) Heatmap for the transcription levels of 982 highly transcribed pseudogenes (maximal FPKM >10). B) Violin plots showing tissue-specificity JS scores of lincRNAs, transcribed pseudogenes, their parents, and the coding genes without pseudogenes. C) Comparison of JS scores at different transcription levels. The white dots mark median and the thick boxes mark the first and third quartile values.

