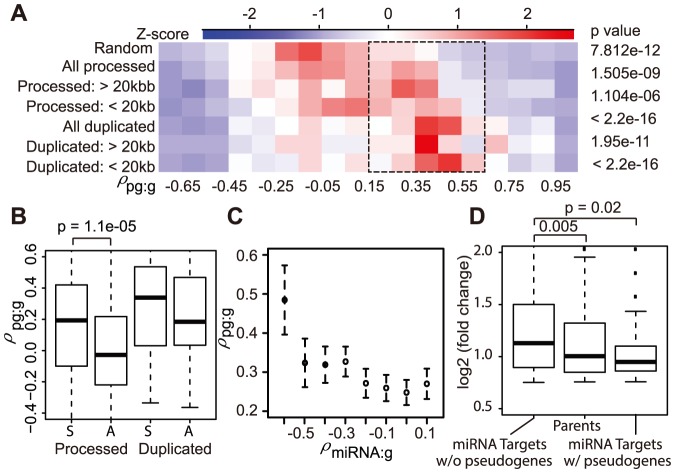
Figure 3. Transcriptional correlations (ρpg:g) between pseudogenes and their parents.
A) A heatmap for distribution of ρpg:g, including data from separation of processed and duplicated pseudogenes into two groups based on the presence of a coding gene within 20 kb. The coefficients between transcribed pseudogenes and randomly chosen coding genes (top) were used as a control for p-value estimation. Colors represent relative numbers of pseudogenes in each ρpg:g range (in Z-score transformation). B) Pseudogenes transcribed in the sense direction (S) exhibited higher ρpg:g than those in the antisense (A). C) The transcriptional correlation between pseudogenes and their parents (ρpg:g) is inversely correlated to the transcriptional correlation between miRNAs and their putative targets (ρmiRNA:g). Genes were binned on their ρmiRNA:g values (x-axis) and then the mean and standard deviation of ρpg:g (y-axis) for each group of genes was plotted. D) Expression of parental genes targeted by miRNAs was less affected by miRNA KD than the targeting genes without pseudogenes. Only genes in response to KD (up >1.3 fold) were analyzed here. Y-axis shows the fold change of KD over control. The miRNA targets were experimentally determined by the CLASH analysis [49]. The middle line in the boxplots mark median and the box lines mark the first and third quartile values (same for boxplots below).

