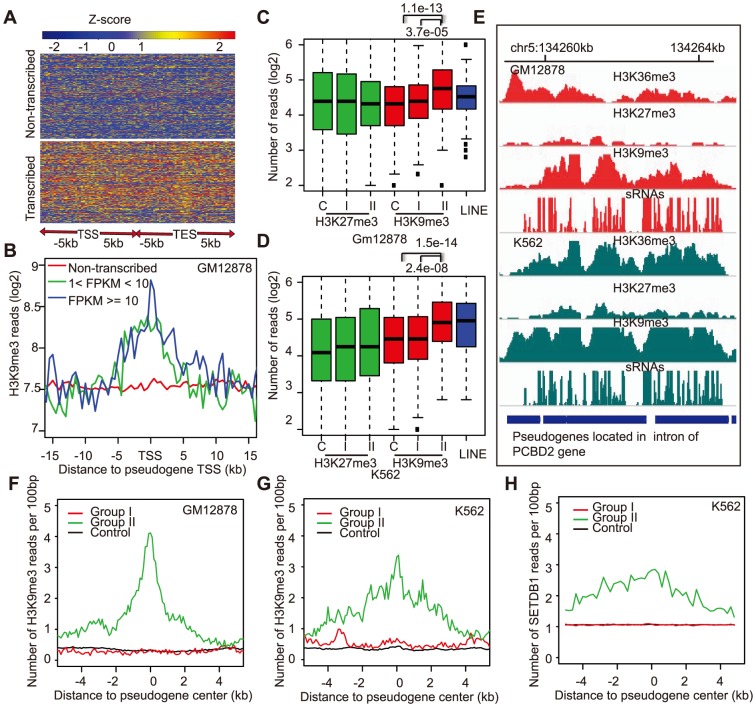
Figure 6. Enrichment of H3K9me3 modification at transcribed pseudogene loci.
A) Heatmap of H3K36me3 near the transcription start sites (TSS) and transcription end sites (TES) of transcribed (bottom) and non-transcribed pseudogenes (top). The color scheme is based on column-based normalization data in GM12878, whereas each row is a pseudogene. B) Transcription level dependent enrichment of H3K9me3 at transcribed pseudogenes. Y-axis shows the average number of H3K9me3 ChIP-Seq reads per 500 bp. C) & D) The level of H3K9me3 (red) but not H3K27me3 (green) was significantly higher at group II pseudogenes (Fig. 5) than at group I pseudogenes or at pseudogenes loci producing no sRNAs (“C”, controls). The H3K9me3 level at a randomly selected set of LINE (blue) was also plotted as positive controls. Y-axis plots ChIP-Seq reads at pseudogene bodies, normalized to per 500-bp sequences. E) The densities of H3K36me3, H3K27me3, and H3K9me3 ChIP-Seq reads and sRNA-Seq reads at a region with multiple pseudogenes derived from a gene encoding NADH dehydrogenase. F–H) The average ChIP-Seq profiles, anchored on pseudogene centers, of H3K9me3 in GM12878 (F) and in K562 (G) and of SETDB1 in K562 (H) for the three groups of pseudogenes. Y-axes show the average numbers of ChIP-Seq reads per 100 bp.

