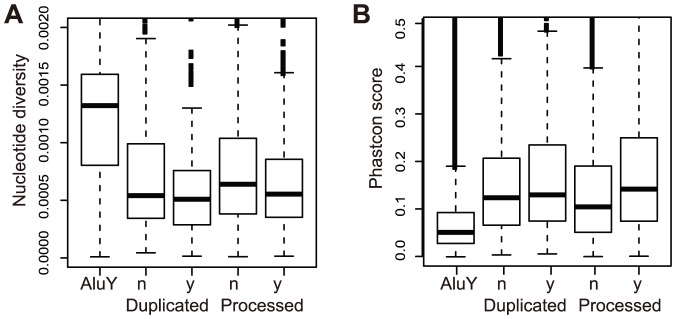
Figure 7. Selection constraints on transcribed pseudogenes.

Comparison of nucleotide diversities in human population (A) and cross-species conservations (B) between non-transcribed (‘n’) and transcribed pseudogenes (‘y’). AluY, a young repeats that emerged recently in primates, was used as control. For duplicated pseudogenes, the median diversities for transcribed and non-transcribed are 0. 00051 and 0.00054 (p<0.02, Wilcoxon test), the values for processed pseudogenes are 0.00055 and 0.00064 (p<3e-06, Wilcoxon test).
