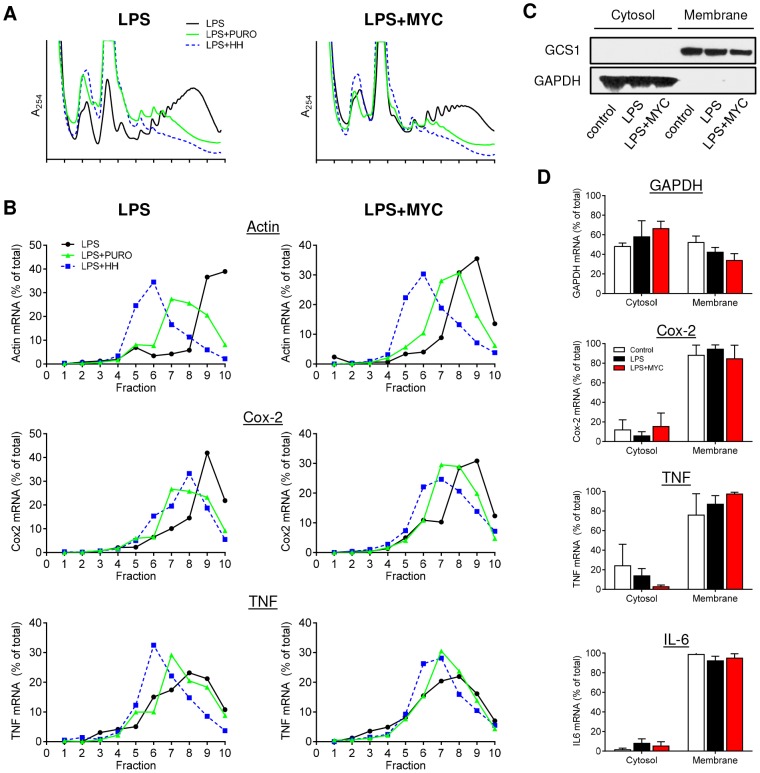
Figure 2. Proinflammatory mRNAs are actively translating in the presence of mycolactone.
RAW264.7 cells were incubated for 1+/−125 ng/ml mycolactone (MYC), then stimulated with LPS. A and B. After 4 hr 100 µg/ml puromycin (PURO) or 5 µM homoharringtonine (HH) were added for 3 min, then CHX was added before lysis and separation of polysomes on a 10–20% sucrose gradient. LPS (solid black line), LPS+PURO (solid green line) and LPS+HH (dotted blue line). A. RNA profiles measured by absorbance at 254 nm. B. Quantitation of specific mRNAs purified from each fraction and analysed by Northern blotting. Signal intensity was quantified by ImageJ analysis of non-saturated phosphorscreen images. Values are presented as percentage of total signal. C and D. Cytosolic and digitonin-resistant membrane fractions were prepared from treated cells as described. C. Western blot of cell fractions (0.5×10⁵ cell equivalents/lane). GCS1; glucosidase I (∼92 kDa), GAPDH (∼40 kDa). D. total RNA was used as a template in qRT-PCR absolute quantitation assays and is presented as % total RNA for each gene (mean±SEM). All data representative of 3 independent experiments.

