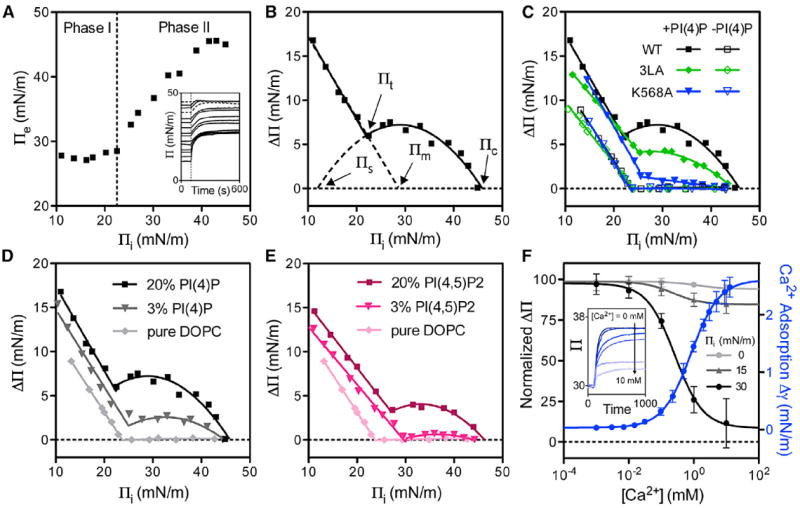
Figure 5. Biphasic Surface Pressure Responses of DrrA in Monolayer Insertion.

(A) Biphasic insertion of DrrA is indicated by a slope change in a Πe versus Πi plot. Inset: insertion time courses at different Πis; dotted lines are baseline corrected.
(B) The same data set was recast into a ΔΠ versus Πi plot and fitted with a biphasic insertion model (see text).
(C) Monolayer insertion of WT DrrA and the K568A and L610A/614A/615A (3LA) mutants with and without 20 mol % PI(4)P in the lipid monolayer.
(D and E) Monolayer insertion of DrrA at the indicated mole fractions of PI(4)P (D) and PI(4,5)P2 (E).
(F) Normalized Ca2+-inhibited DrrA insertion at different Πis overlaid with Ca2+ affinity measurements determined by surface pressure titration. Inset: insertion time courses of DrrA at different Ca2+ concentrations. Values and errors bars represent mean and SD for two to four independent measurements.
