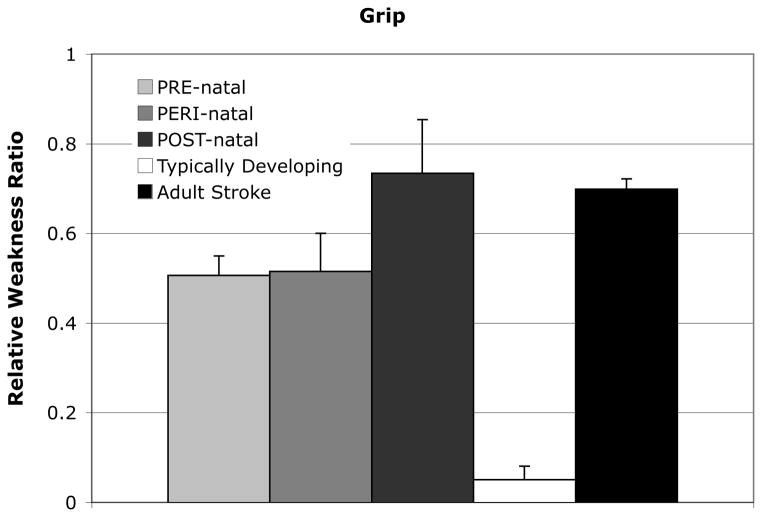
Figure 4.
Relative weakness ratio for grip in 3 CH injury timing groups, typically developing participants, and participants with an adult-onset stroke resulting in hemiparesis. The relative weakness ratio was calculated as the difference between maximal torques between arms divided by the sum. A value close to 0 indicates equivalent strength in the paretic and non-paretic, or dominant and non-dominant limbs, while a value closer to 1 indicates a larger non-paretic torque than paretic. Standard error bars are shown. There was a significant effect of group (F=2.274, p<0.001) in a one-way ANOVA. Adult stroke data published elsewhere.40

