
Figure 2.
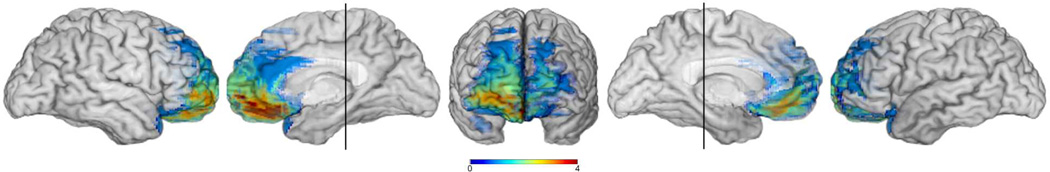
Lesion overlap of the four brain damaged comparison (BDC) participants. The colorbar indicates the number of lesion overlaps (range = 0–4). The vertical line through the left and right mesial views is through the midportion of the hippocampus indicating that no BDC had MTL lesions.