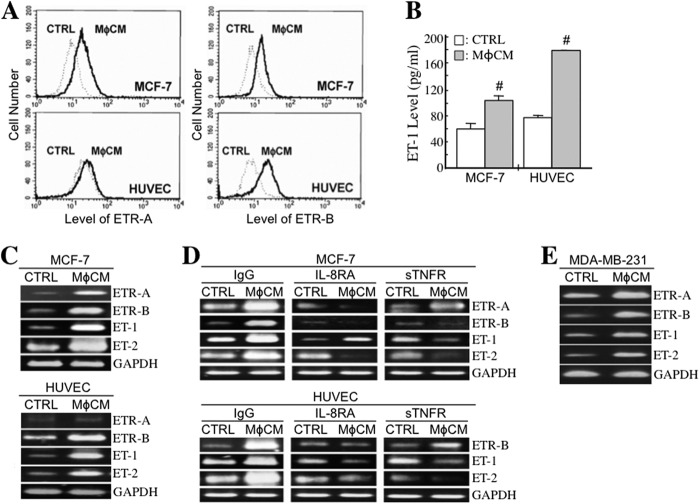
FIGURE 1.
MφCM induces ET and ETR expression in HUVECs and breast cancer cells. A, flow cytometric analysis of cellular ETR-A and ETR-B protein levels in HUVECs and MCF-7 cells treated with control medium (CTRL) or MφCM for 24 h. B, determination of the ET-1 levels produced by HUVECs and MCF-7 cells after MφCM treatment. HUVECs or MCF-7 cells (3 × 10⁵) were treated with 2 ml of control medium or MφCM for 24 h and incubated with fresh culture medium for another 24 h. The conditioned media were harvested for ELISA. The data represent the mean ± S.D. (error bars) of three independent experiments. #, p < 0.05 compared with CTRL. C, RT-PCR analysis of the mRNA levels of ETR-A, ETR-B, ET-1, and ET-2 in HUVECs and MCF-7 cells treated with control medium or MφCM for 24 h. The levels of GAPDH mRNA were also detected as internal controls. D, RT-PCR analysis of the mRNA levels of ETR-A, ETR-B, ET-1, and ET-2 in HUVECs and MCF-7 cells treated for 24 h with control medium or MφCM plus 500 ng/ml control IgG, 500 ng/ml IL-8RA, or 100 ng/ml sTNFR (prepared in PBS). E, RT-PCR analysis of the mRNA levels of ETR-A, ETR-B, ET-1, and ET-2 in MDA-MB-231 cells treated with control medium or MφCM for 24 h. All of the data are the representative of at least three independent experiments.

