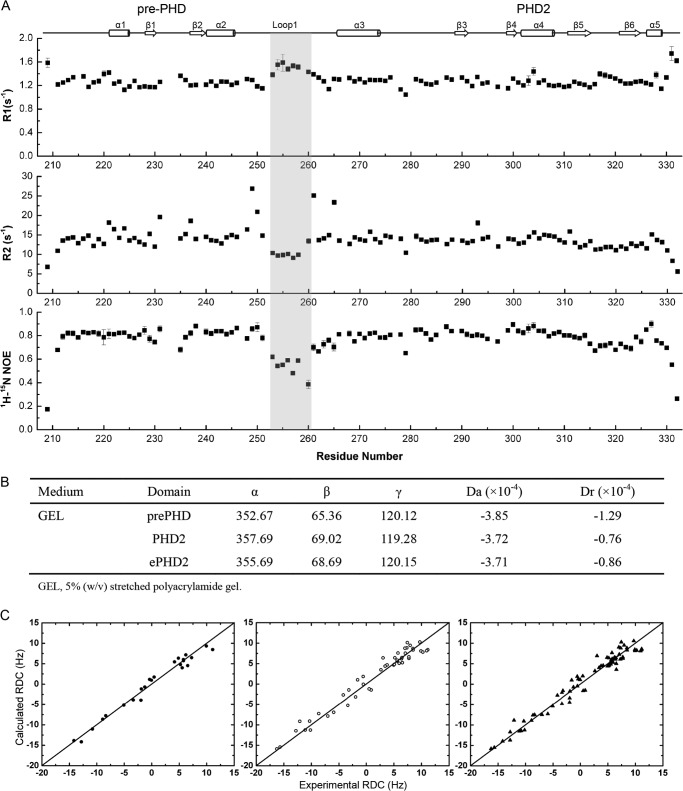
FIGURE 5.
Backbone NMR relaxation data and RDC analysis for PHF6-ePHD2 domain. A, R1, R2, and heteronuclear 1H-15N NOE of PHF6-ePHD2 domain. The secondary structural elements are shown at top. The similar relaxation characters between the pre-PHD and PHD2 fingers indicate two domains fold as an integrated unit. However, the segment from 253 to 260 amino acid residues of loop L1, enclosed by a gray box, is relatively more flexible than the core region (relatively lower R2 1H-15N NOE values and higher R1 values than those of other regions). B, characteristics of the alignment tensors for pre-PHD, PHD2, and ePHD2 domain. The Euler angles (α, β, and γ), in degrees, characterize the orientation of the principal axes' frame of the alignment tensors of pre-PHD, PHD2, and ePHD2 with respect to the Protein Data Bank coordinate frame for each domain. C, panels represent the agreement between the measured and calculated data for protein core residues. The correlation coefficient is 0.98 (pre-PHD, left, filled circle), 0.98 (PHD2, middle, open circle), and 0.98 (ePHD2, right, filled triangle).

