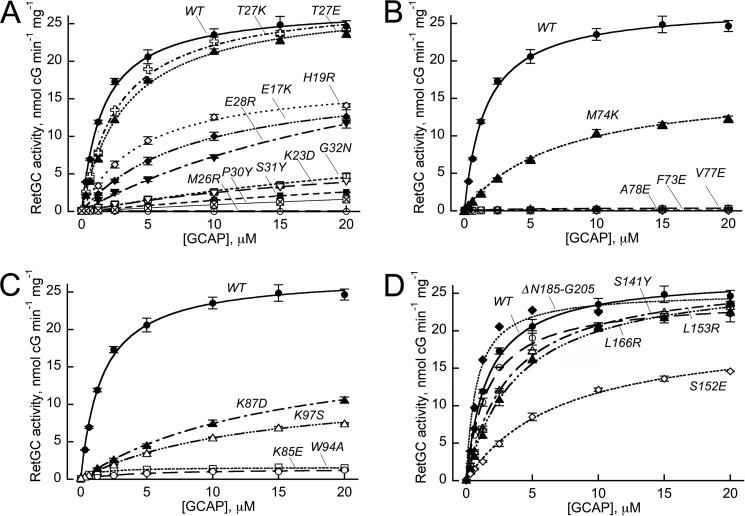
FIGURE 2.
Dose dependence of RetGC1 activation by GCAP1 mutants.
A, mutations in EF-hand I: WT (●); E17K (♦); H19R (♢); K23D (▿); M26R (○); T27K ( ); T27E (▴); E28R (▾); P30Y (⊠); S31Y(■); and G32N (□). B, mutations in EF-hand 2: WT (●); F73E (♢); M74K (▴); V77E (○); and A78E (□). C, mutations in the hinge region and EF-hand 3: WT (●); K85E (○); K87D (▴); W94A (□); and K97S (▵). D, mutations in EF-hand 4 and C-terminal segment: WT (●); S141Y (○); S152E (♢); L153R (▵); L166R (▴); and deletion, Asn-185–Gly-205 (♦). The activation of recombinant RetGC1 by increasing concentrations of purified GCAP1 was assayed in the presence of 2 mm EGTA and 10 mm Mg2+; the data points (mean ± S.D., n = 5 for WT and P30Y, n = 3 for V77E and A78E, and n = 2 for other mutants) were fitted using Synergy KaleidaGraph 4 utilizing the standard Levenberg-Marquardt algorithm of nonlinear least-squares routines, assuming Michaelis function, a = amax [GCAP]/(K1/2 GCAP + [GCAP]), where a is the activity of RetGC in the assay, amax is the maximal activity of RetGC, [GCAP] is the concentration of GCAP, and K1/2 GCAP is the GCAP concentration required for half-maximal activation.

