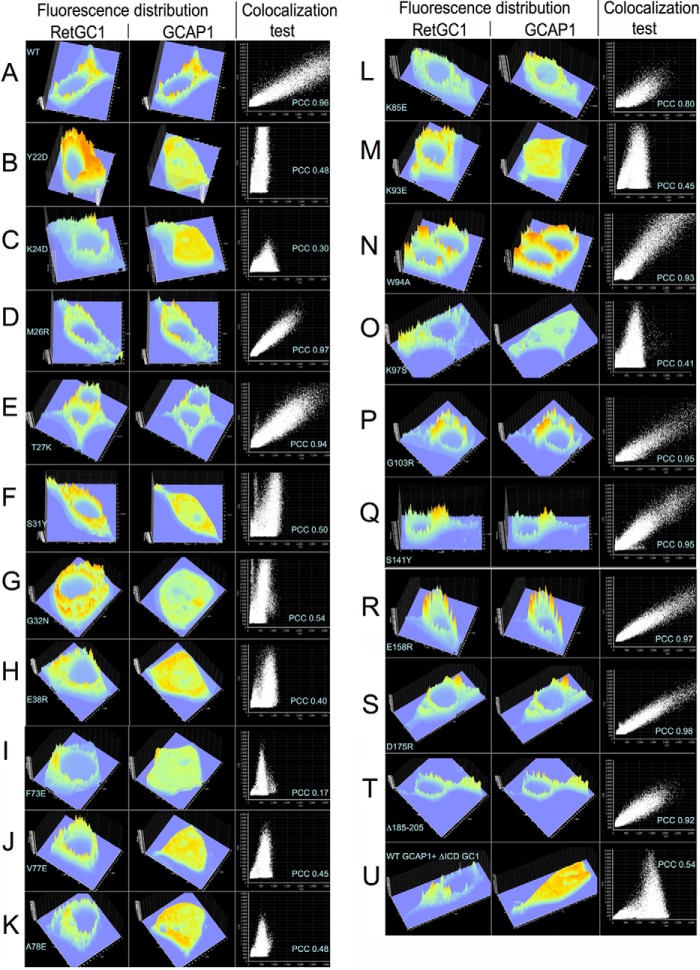
FIGURE 6.
mOrange-RetGC1 (left panels) and GCAP1-GFP (middle panels) fluorescence intensities distribution in HEK293 cells and their co-localization tests (right panels). Fluorescence images acquired as presented in Figs. 4 and 5 were processed without editing using Olympus Fluoview FV10-ASW software to reconstruct the fluorescence intensities over the entire confocal cell image in each case. The examples of a cross-correlation test for the red (y axis) versus green (x axis) pixels in each image are shown in the right panels and include the Pearson correlation coefficient (48). The PCC values for each mutant averaged from multiple cells were then summarized in Table 3. A–T, mOrange-RetGC1 co-expressed with the following variants of GCAP1-GFP: A, WT; B, Y22D; C, K24D; D, M26R; E, T27K; F, S31Y; G, G32N; H, E38R; I, F73E; J, V77E; K, A78E; L, K85E; M, K93E; N, W94A; O, K97S; P, G103R; Q, S141Y; R, E158R; S, D175R; and T, deletion, Asn-185–Gly-205. U, wild type GCAP1-GFP was co-expressed with the extracellular portion of RetGC1 containing red fluorescent tag (52) but lacking the entire cytoplasmic segment required for GCAP binding (52, 53).

