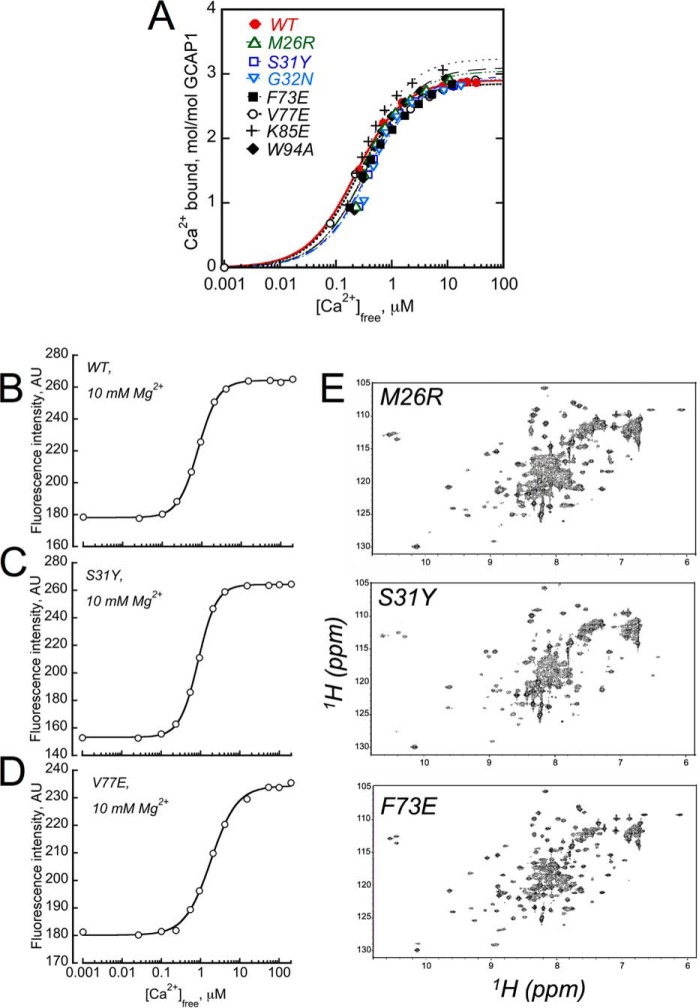
FIGURE 7.
GCAP1 mutants that cannot activate RetGC1 can still bind Ca2+.
A, the normal Ca2+ binding stoichiometry of 3/GCAP1 remains unchanged in the mutants that completely failed to activate the cyclase: WT (●); M26R (▵); S31Y (□); G32N (▿); F73E (■); V77E (○); K85E ( ); and W94A (♦). Ca2+-binding isotherms were obtained using the Ca2+ fluorescent indicator dye Fluo-4FF (10, 48). The fluorescence data were fitted using a simplified saturating hyperbolic function: ([Ca]bound/[GCAP]) = Bmax × [Ca]free/([Ca]free + Kd), where Bmax is the mol of Ca2+ ions bound per mol of GCAP at saturation, Kd is the apparent dissociation constant, [Ca]bound is the concentration of Ca2+ bound to GCAP1 calculated as [Ca]bound = [Ca]total − [Ca]free. The data shown are representative of 2–4 independent experiments producing in each case virtually identical Ca2+ binding stoichiometries. B–D, Ca2+-dependent increase in Trp-94 fluorescence (9, 10) was tested in WT, S31Y, and V77E GCAP1, respectively. The analysis was performed as described under “Experimental Procedures” in the presence of 10 mm MgCl2. E, NMR spectra of GCAP1 mutants. Uniform 15N-labeled samples of Ca2+-bound and myristoylated forms of M26R (top), S31Y (middle), and F73E (bottom) were prepared as described under “Experimental Procedures.” All NMR spectra were recorded at 37 °C using a Bruker Avance III NMR spectrometer equipped with cryogenic TCI probe. Three downfield peaks at ∼10.5 ppm are assigned to Gly-69, Gly-105, and Gly-149 (55), indicating that Ca2+ is bound at EF-2, EF-3, and EF-4. Minor spectral differences are observed for exposed residues in unstructured regions, most likely because of small differences in solvent conditions. However, the overall chemical shift patterns in these spectra are similar to that of wild type GCAP (54, 55), thus confirming that each of the mutants is properly folded and structurally intact.

