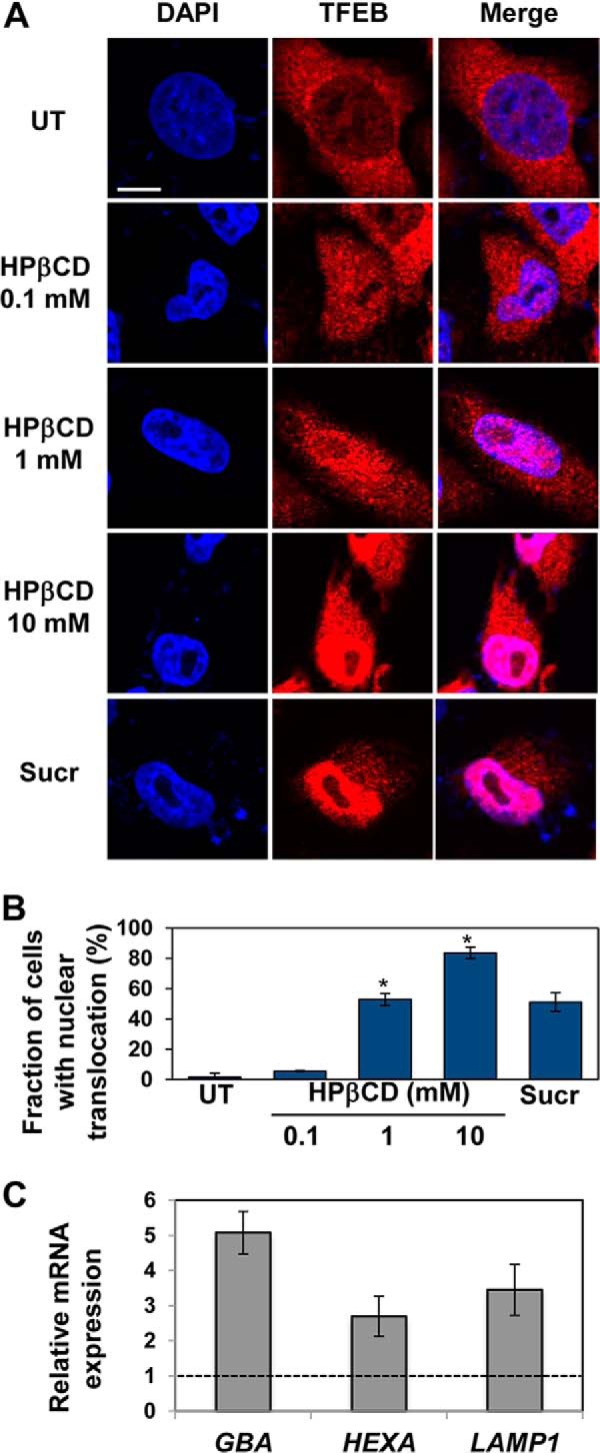
FIGURE 1.

HPβCD treatment results in activation of TFEB and the CLEAR network. A, confocal microscopy analysis of TFEB subcellular localization in HeLa cells stably transfected with TFEB-FLAG treated with 0.1, 1, and 10 mm HPβCD or sucrose 100 mm for 1 day. Co-localization of DAPI (blue, first column) and an anti-FLAG antibody (red, first column) is shown in purple (third column). The scale bar is 10 μm. UT, untreated; Sucr, sucrose. B, percentage of cells presenting nuclear localization of TFEB-FLAG upon treatment with HPβCD (0.1, 1, and 10 mm) or sucrose (100 mm). Representative (∼30) fields containing ∼50 cells were analyzed (p < 0.05; *, p < 0.01). Data are reported as the mean ± S.D. C, relative mRNA expression levels of representative genes of the lysosome system in HeLa cells stably transfected with TFEB-FLAG treated with 1 mm HPβCD for 1 day. mRNA expression levels of GBA, HEXA, LAMP1, were obtained by qRT-PCR, corrected by the expression of the house-keeping gene GAPDH, and normalized to those of untreated cells (dashed line). Data are reported as the mean ± S.D. n ≥ 3; p < 0.05.
