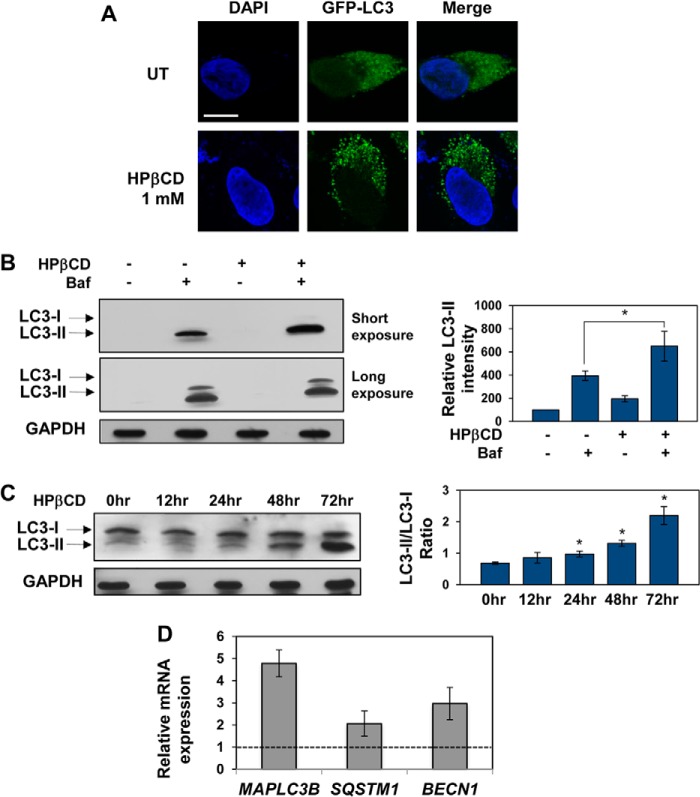
FIGURE 2.
HPβCD treatment results in activation of autophagy. A, confocal microscopy analysis of LC3 expression in HeLa/TFEB cells transfected for the expression of LC3-GFP for 20 h and treated with 1 mm HPβCD for additional 24 h. The scale bar is 10 μm. UT, untreated. B, Western blot analyses of LC3 isoforms and GAPDH (used as loading control) in HeLa/TFEB cells treated with 1 mm HPβCD and 100 nm bafilomycin for 24 h and quantification of LC3-II bands. Band intensities were quantified with ImageJ analysis software, corrected by GAPDH band intensities, and divided by the values obtained in untreated samples (p < 0.01; *, p < 0.05). Baf, bafilomycin. C, Western blot analyses of LC3 isoforms and GAPDH (used as loading control) in HeLa/TFEB cells treated with 1 mm HPβCD for 0, 12, 24, 48, and 72 h and quantification of LC3-II/LC3-I ratios at each time point. Band intensities were quantified as described in A (*, p < 0.05). D, relative mRNA expression levels of representative genes of the autophagy system in HeLa cells stably transfected with TFEB-FLAG treated with 1 mm HPβCD for days. mRNA expression levels of MAPLC3B, SQSTM1, and BECN1 were obtained as described in Fig. 1. Data are reported as the mean ± S.D. n ≥ 3; p < 0.01.

