FIGURE 6.

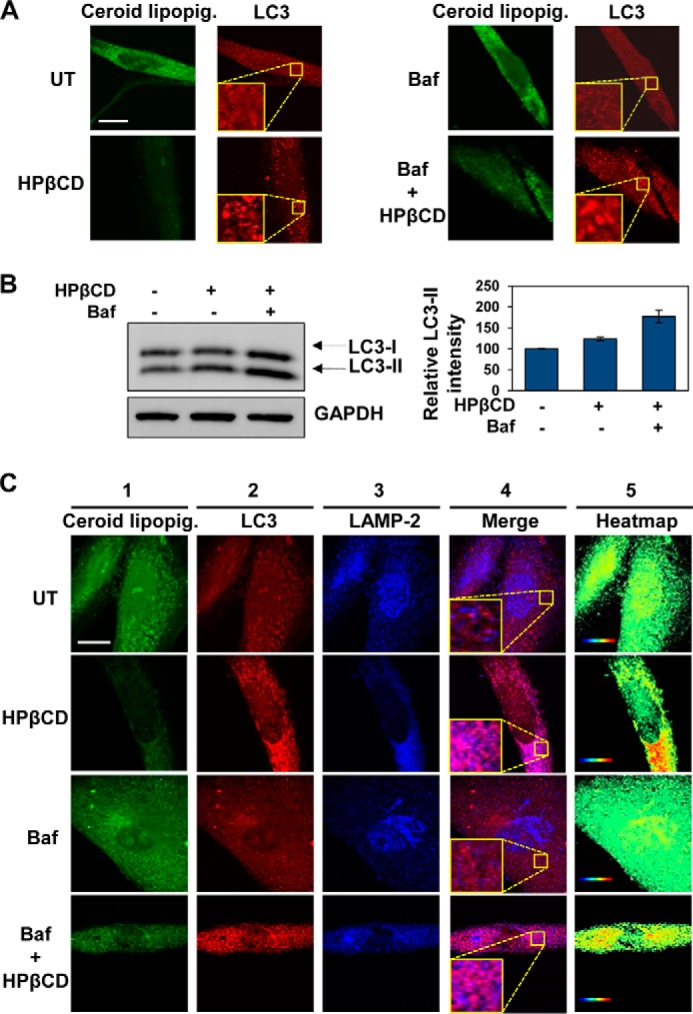
HPβCD treatment activates autophagic clearance. A, confocal microscopy analysis of ceroid lipopigment (green) and LC3 (red) in LINCL fibroblasts treated with 1 mm HPβCD and 100 nm bafilomycin for 3 days, evaluated by detecting green autofluorescence and binding of an anti-LC3 antibody, respectively. The scale bar is 20 μm. UT, untreated; Baf, bafilomycin. B, Western blot analyses of LC3 isoforms and GAPDH (used as loading control) in LINCL fibroblasts treated with 1 mm HPβCD and 100 nm bafilomycin for 24 h and quantification of LC3-II bands. Band intensities were quantified with ImageJ analysis software, corrected by GAPDH band intensities, and divided by the values obtained in untreated samples (p < 0.05). C, confocal microscopy analysis of ceroid lipopigment (green, first column), LC3 (red, second column), and LAMP-2 (blue, third column) in LINCL fibroblasts treated with 1 mm HPβCD and 100 nm bafilomycin for 3 days, evaluated by detecting green autofluorescence, binding of anti-LC3 antibody, and binding of anti-LAMP-2 antibody, respectively. Co-localization of LC3 and LAMP-2 is shown in purple (fourth column). Heatmaps of co-localization images were obtained with ImageJ analysis software (fifth column). Hot colors represent positive correlation (co-localization), whereas cold colors represent negative correlation (exclusion). The scale bar is 20 μm.
