
FIGURE 1.
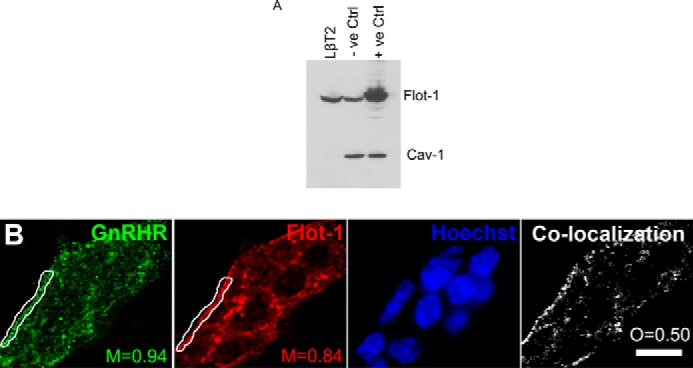
Immunofluorescence shows the GnRHR co-localizes with Flot-1 in LβT2 cells. A, whole LβT2, untransfected COS-7 (−ve Ctrl) and Flot-1 transfected COS-7 (+ve Ctrl) cell lysates were loaded on a 10% SDS-PAGE gel followed by transfer onto nitrocellulose membrane and probing with specific antibodies to Flot-1 and Cav-1. B, LβT2 cells were grown on glass coverslips and live cell-stained with rabbit anti-GnRHR followed by fixation and staining with a mouse anti-Flot-1 antibody. Thereafter, the coverslips were incubated with anti-rabbit Alexa488 (green) and anti-mouse Cy3 (red) antibodies. Nuclei were stained with Hoechst (blue) before mounting in Mowiol. Staining was visualized with a Zeiss LSM510 Meta confocal microscope using the 63× objective, and a representative image is shown for a group of cells, as indicated by the multiple nuclei visible in the Hoechst stain. Manders co-localization coefficients (M) are shown for the red and green channels in regions of interest in the vicinity of the cell membrane. The panel on the right marked Co-localization displays a map of co-localized pixels for the green and red channels across the entire group of cells. The degree of overlap between the two patterns is indicated by the overlap coefficient (O). The scale bar represents 10 μm. The results shown are representative of three independent experiments.