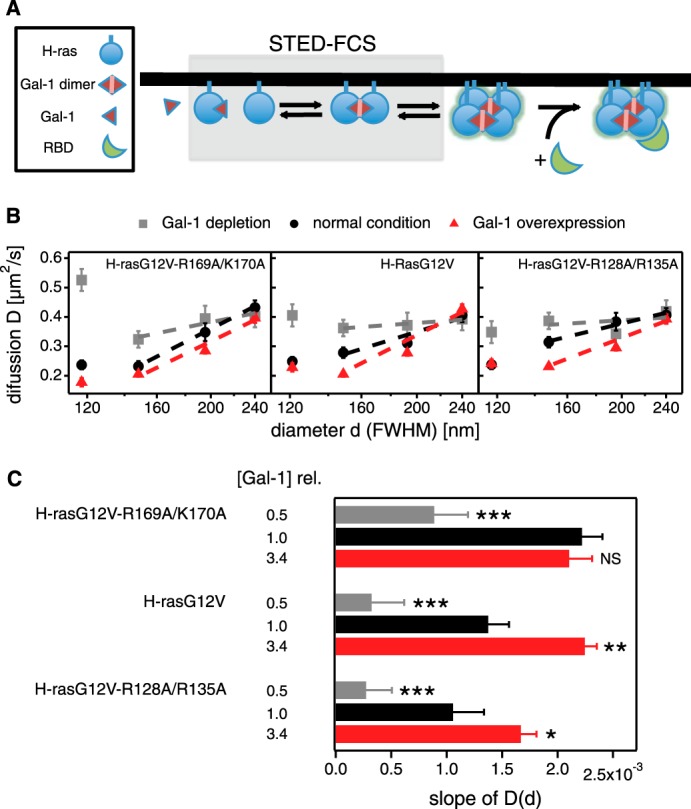
FIGURE 3.

STED-FCS experiments reveal specific hindrance of H-ras orientation mutant diffusion in response to galectin-1 levels. A, schematic representation of nanocluster formation and effector recruitment. Gray box highlights the events that are studied by STED-FCS. B, diffusion of H-ras orientation mutants was studied using STED-FCS to determine their degree of hindered diffusion. The apparent diffusion coefficient D of H-rasG12V-R169A/K170A (left), H-rasG12V (center), and H-rasG12V-R128A/R135A (right) was determined in cells with Gal-1 depletion (gray squares), normal endogenous Gal-1 levels (black circles), and Gal-1 overexpression (red triangles). The values for D are displayed against the diameter d (full width at half-maximum) of the observation area to identify anomalous diffusion, which is apparent by deviations from a constant D(d) (i.e. a flat line). For each value of D, a minimum of seven and up to 30 STED-FCS autocorrelation curves were analyzed. Linear fits to D(d) for d between 150 and 240 nm are plotted. Error bars represent the mean ± S.E. C, slopes of linear fits to data shown in B. The greater the slope the more hindered the diffusion. The cellular total Gal-1 concentration relative to endogenous galectin-1 in control BHK cells ([Gal-1]rel) is displayed to the left of the data. Colors of data bars match those in B. Error bars represent 1 S.D. of the linear fits. The coefficients of determination (R2) from top to bottom are as follows: 0.84, 0.99, 0.99, 0.96, 0.94, 0.97, 0.17 (contains basically one outlier), 0.93, and 0.98. Statistical differences between treated and untreated cells were tested. See under “Experimental Procedures” for details about statistical analysis (NS, nonsignificant, *, p < 0.05; **, p < 0.01; ***, p < 0.001).
