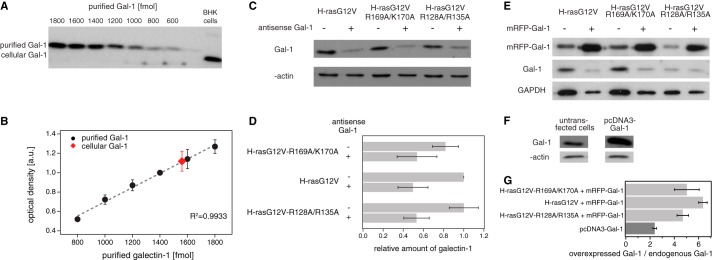
FIGURE 4.

Galectin-1 level calibration in BHK cells. A, representative Western blot images displaying protein bands of serial dilutions of purified Gal-1 and of cellular Gal-1. B, standard curve showing the optical density of the band as a function of the amount of Gal-1 (n = 3). Displayed in red is the cellular Gal-1. The amount of Gal-1 in 105 untransfected BHK cells was established to be 1560.01 fmol, and the volume of an average cell was calculated to be 1564.06 μm3 (radiuses of trypsinized cells, r = 7.20 ± 0.16 μm, n = 33). Thus, we determined that the Gal-1 concentration in an average BHK cell is ∼10.0 ± 0.9 μm. C, representative Western blot of Gal-1 knockdown experiments. Indicated samples were probed with antibodies as shown on the left. D, relative amounts of Gal-1 in BHK cells expressing indicated constructs. Raw intensities were first normalized against intensities of β-actin and then plotted relative to the normalized signal of galectin-1 in the control sample (H-rasG12V). E, representative Western blots for co-overexpression using mRFP-Gal-1. Labeling shows expressed constructs on top and probed molecular species on the left. Endogenous and overexpressed Gal-1 have different molecular weights due to the mRFP label in the overexpressed Gal-1. The unspecific signal from the galectin-1-antibody that is present when mRFP-Gal-1 is overexpressed was subtracted in our quantification. F, representative Western blots for overexpression using pcDNA3-Gal-1. G, ratio between the overexpressed Gal-1 (pcDNA3-Gal-1 or pmRFP-Gal-1) and the endogenous Gal-1. In the case of overexpressed pmRFP-Gal-1, calculations were done independently for cells expressing indicated H-ras mutants. In the case of pcDNA3-Gal-1, levels were determined on BHK cells with endogenous Ras (see Table 2). Results are averaged from three independent experiments.
