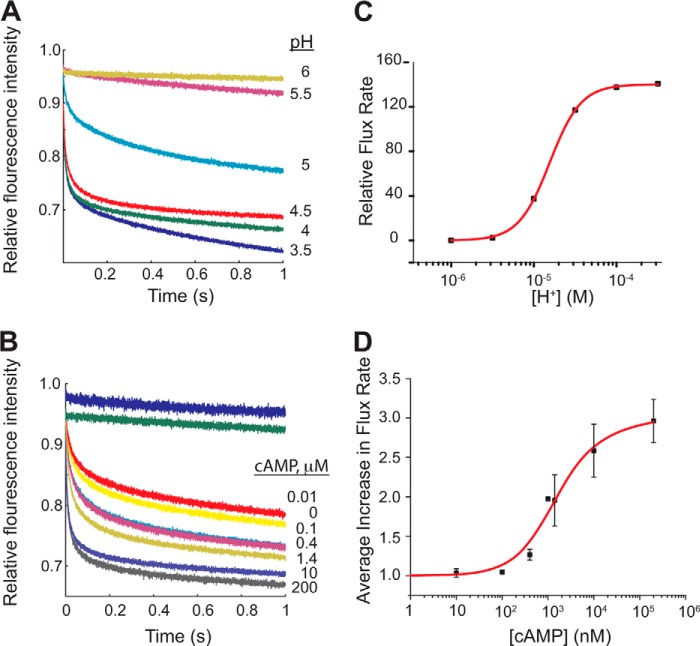
FIGURE 3.
Activity of KcsA/MloK1 is modulated by pH and cAMP. Representative experiments showing the normalized time course of ANTS fluorescence quenching due to Tl+ influx through KcsA/MloK1 channels reconstituted into LUVs at A, 200 μm cAMP and different extraliposomal pH values as follows: 6.0 (yellow), 5.5 (maroon), 5.0 (cyan), 4.5 (red), 4.0 (green), and 3.5 (blue); B, pH 4.0 and different cAMP concentrations as follows: 0 (yellow), 10 nm (red), 100 nm (cyan), 400 nm (pink), 1.4 μm (gold), 10 μm (gray), 200 μm (purple). The fluorescence time course in protein-free LUVs at pH 4.0 and channel-containing LUVs at 200 μm cAMP at pH 7.0 are shown in blue and green, respectively. C, changes in quench rate (Tl+ influx through the channels) in 200 μm cAMP as a function of pH. The red curve is a fit to a single-site curve with the following parameters: n = 2.3 ± 0.05 and pK½ = 4.7 ± 0.01 (mean ± error of the fit). D, average increase in flux through the channel as a function of cAMP (at pH 4). The relative flux increased ∼3-fold between 0 cAMP and 200 μm cAMP. Symbols are mean ± S.E. from four different experiments with protein from four different preparations (except for the experiment at 1 μm, which was done only once, and at 400 nm and 1.4 μm, which were done three times). Normalization of each data set was accomplished by dividing the relative flux rate at 0 cAMP from the flux at each represented cAMP concentration. The red curve is a fit to a modified Hill equation: v/R0 = ((Vmax/R0)(L)/(K½n + Ln)) + 1 from which the following parameters were derived: Vmax/R0 = 1.50 ± 0.69, n = 0.98 ± 0.04, and K½ = 1.19 ± 0.49 μm, where v is the flux rate; Vmax is the maximal flux rate; R0 is the rate in the absence of cAMP; L is the cAMP concentration; K½ is the cAMP concentration at half the maximal flux rate, and n is the Hill coefficient.

