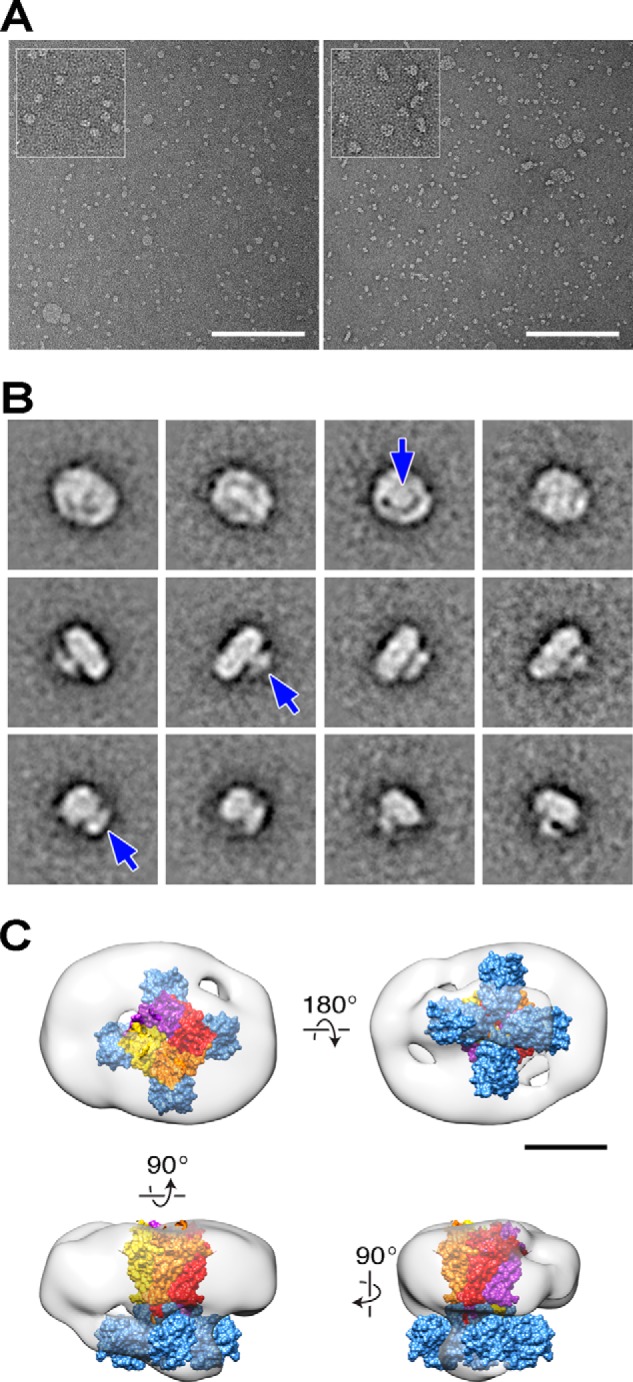
FIGURE 6.

Transmission electron microscopy imaging of KcsA/MloK1 chimera incorporated into nanodiscs. A, TEM images comparing empty (left) and KcsA/MloK1-containing (right) nanodiscs. Scale bars, 200 nm. Insets show a 2-fold zoom of selected areas. B, representative class average images of KcsA/MloK1 nanodiscs. The top row shows averages interpreted as top views; the middle row shows side views, and the bottom row shows side views rotated by 90°. White density protruding from of the disc most likely corresponds to the CNBDs from a single tetramer (arrows). Each frame size is 35.5 × 35.5 nm. C, single particle three-dimensional reconstruction of the KcsA/MloK1 nanodisc, with an overlaid KcsA/MloK1 homology model docked into EM density (KcsA: yellow, orange, red, and purple, Protein Data Bank code 1K4C; CNBD: blue, Protein Data Bank code 3CL1). Scale bar, 5 nm.
