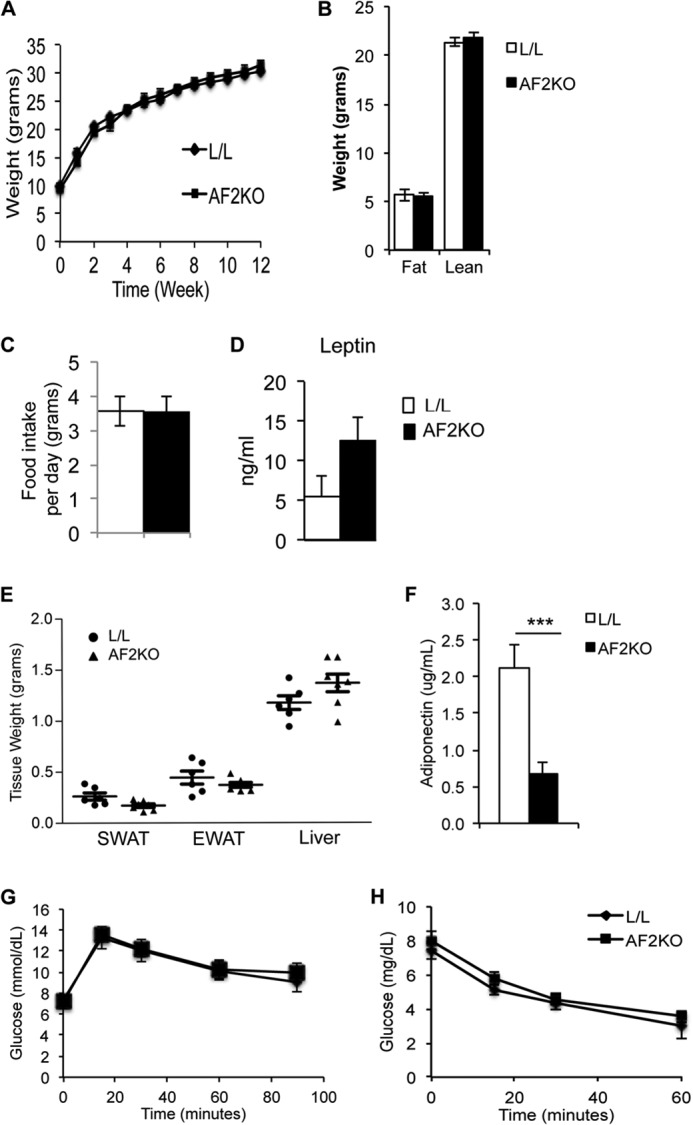
FIGURE 2.

Adipose depot weights in 15-week-old AF2KO and L/L control mice. A, body weights of standard diet-fed mice starting at 3 weeks of age. B, MRI analysis of total body fat and lean mass. C, quantification of food intake per day. D, quantification of plasma leptin levels. E, quantification of wet weights of SWAT and EWAT and liver from 15-week-old male AF2KO and L/L controls. Although adipose depot weights trended lower, the differences were not statistically significant. F, fasting plasma adiponectin levels were significantly lower in AF2KO mice, indicative of adipose tissue dysfunction (n = 5 per genotype). ***, p < 0.0001. Insulin tolerance test (G) and glucose tolerance test (H) both indicated that AF2KO mice have similar insulin and glucose tolerance. n = 6 mice/genotype. Data are represented as mean ± S.E. (error bars) for all panels.
