FIGURE 3.
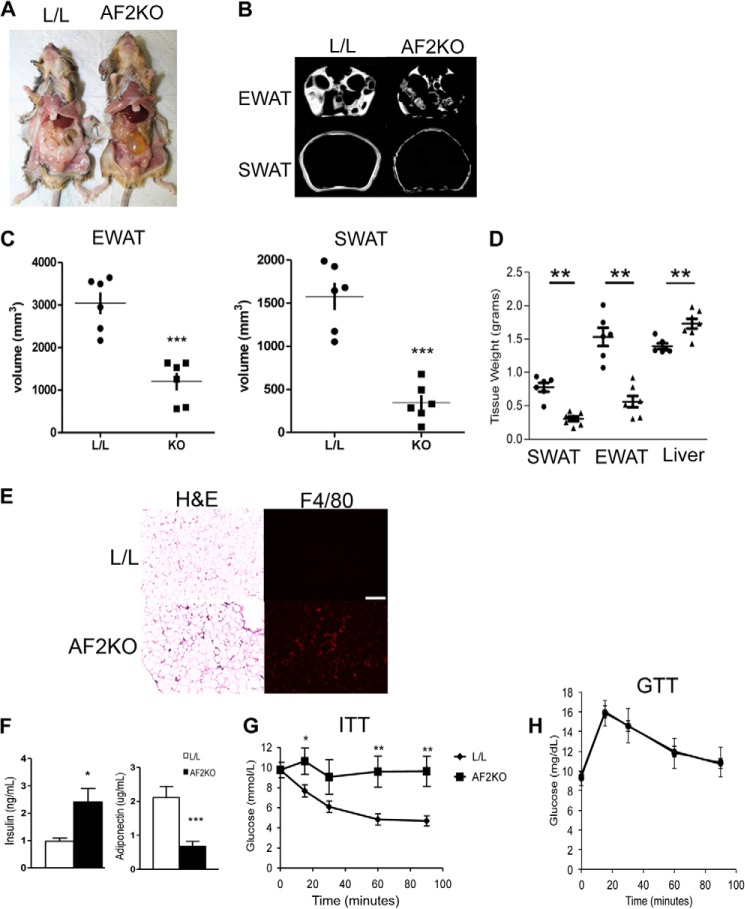
Mice with adipose-specific deficiency of FIT2 are lipodystrophic and insulin-resistant. A, gross anatomical view of a 24-week-old control (L/L) and a knock-out mouse with adipose deficiency of FIT2 (AF2KO) indicates reduced white adipose mass. B, images from MRI analysis of living mice indicate reduced amounts of SWAT and EWAT in AF2KO mice. C, volumetric quantification of adipose-specific depots derived from MRI analysis indicate reduced volumes of EWAT and SWAT in AF2KO mice. D, quantification of adipose tissue depot and liver wet weights indicating reduced adipose depot mass and enlarged liver weight in AF2KO mice. Data are represented as mean ± S.D. Circles and triangles, L/L and AF2KO, respectively. E, histological sections of EWAT from L/L and AF2KO mice stained with H&E or immunolocalization of F4/80. The sections shown for H&E and F4/80 are non-consecutive. F, fasting plasma insulin and adiponectin (n = 5 mice/genotype). G, insulin tolerance test; H, glucose tolerance test. n = 5–7 mice/genotype. Data are represented as mean ± S.E. (error bars) for C, D, and F–H. *, p < 0.01; **, p < 0.001; ***, p < 0.0001.

