FIGURE 9.
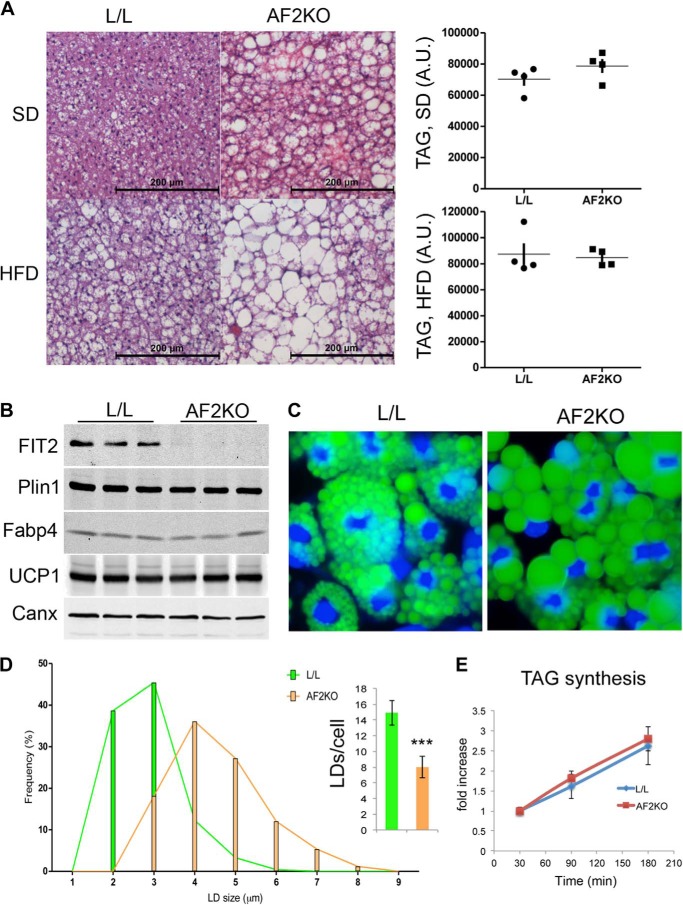
FIT2 deficiency in BAT results in increased size of LDs. A, histological sections of BAT from L/L and AF2KO mice stained with H&E show the appearance of large unilocular LDs in AF2KO BAT. The graph on the right shows the quantification of TAG using TLC analysis in equal amounts of BAT from AF2KO and L/L mice (n = 4 mice/genotype). B, primary BAT precursor cells were isolated from L/L and AF2KO littermates and differentiated in vitro into brown adipocytes. Western blot analysis of FIT2, other PPARγ adipocyte markers, and the BAT cell marker UCP1 indicates FIT2 deficiency in AF2KO adipocytes but normal expression of other PPARγ adipocyte markers and UCP1. A.U., arbitrary units. C, LDs were stained with BODIPY 493/503 (green) at day 6 in differentiated BAT adipocyte precursor cells. Nuclei were stained with Hoechst 33342 (blue). D, quantification of LD size from cells set up in C indicates that AFK2O cells produce larger but fewer LDs than L/L control cells. E, BAT precursor cells were differentiated to day 6 and treated with 50 μm [14C]oleate-BSA complex for the times indicated, and radioactive TAG was quantified by TLC and phosphorimaging analysis. Data are represented as mean ± S.E. (error bars). ***, p < 0.0001.

