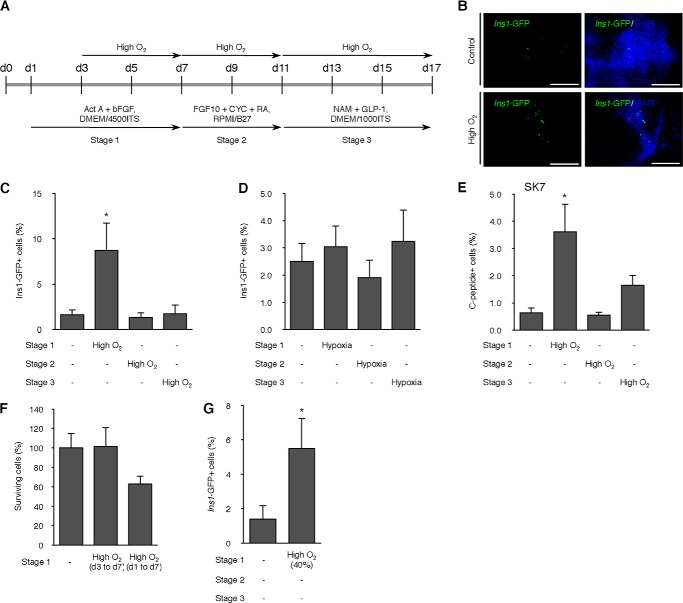
FIGURE 2.
Effect of high O2 condition on differentiation efficiency of mESCs. A, scheme of the timeline of high O2 condition. B, immunofluorescence for Ins1-GFP on day 17 of differentiation in ING112 cells treated with a high O2 condition during stage 1. Scale bars, 200 μm. C, values are the percentage of Ins1-GFP-positive cells per well of the cells treated with high O2 condition (60% O2) during three different stages. *, p < 0.05 versus corresponding control. n = 8 each. D, values are the percentage of Ins1-GFP-positive cells per well of the cells treated with hypoxic condition (5% O2) during three different stages. n = 20 each. E, values are the percentage of C-peptide-positive cells per well of the cells treated with the high O2 condition (60% O2) during three different stages in mESC line SK7. *, p < 0.05 versus corresponding control. n = 6 each. F, cell viability assay on the number of viable cells after treatment with the high O2 condition (60% O2) during day 1 to day 7 or day 3 to day 7. n = 6 each. G, values are the percentage of Ins1-GFP-positive cells per well of the cells treated with the high O2 condition (40% O2) during stage 1. *, p < 0.05 versus corresponding control. n = 6 each. Error bars, S.E.

