FIGURE 9.
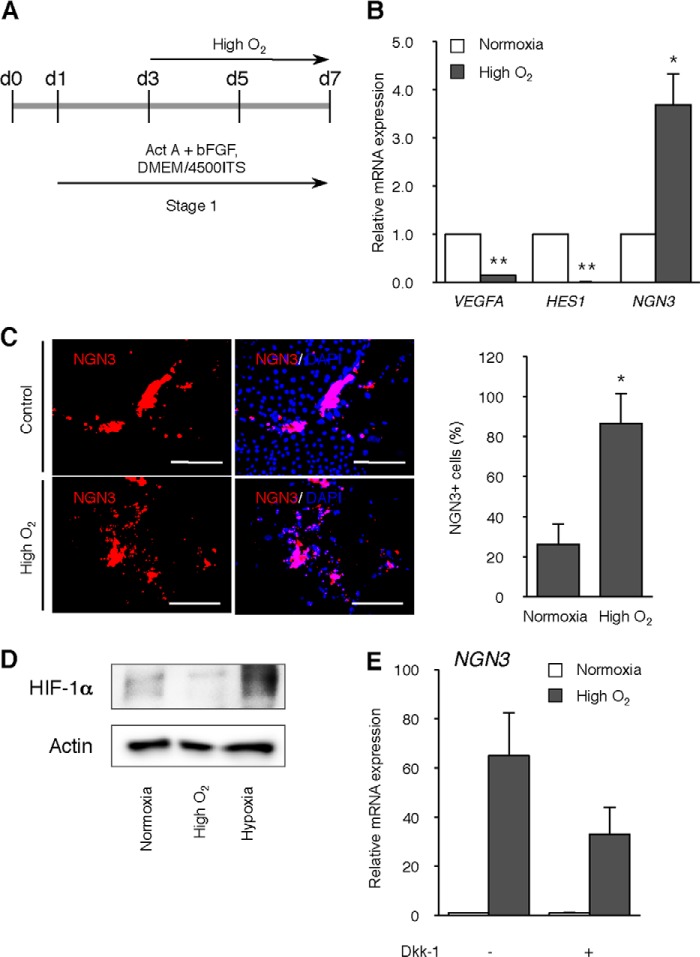
Effect of high O2 condition on NGN3 gene expression of hiPSCs. A, scheme of the timeline of high O2 condition. B, levels of VEGFA, HES1, and NGN3 genes were analyzed at day 7 of differentiation in normoxia or high O2-treated C23 cells by qPCR. *, p < 0.05; **, p < 0.01 versus corresponding control. n = 4 each. C, immunofluorescence for NGN3 on day 11 of differentiation in C23 cells treated with high O2 condition during stage 1. Scale bars, 200 μm. Right graph, values are the percentage of NGN3-positive cells/well of the cells treated with high O2 condition during stage 1. *, p < 0.05 versus corresponding control. n = 3 each. D, levels of HIF-1α and β-actin (loading control) were analyzed on day 6 of differentiation in normoxia, high O2, or hypoxia (1% O2; positive control)-treated C23 cells by immunoblotting. E, levels of the NGN3 gene were analyzed on day 6 of differentiation in normoxia or high O2-treated C23 cells with or without Wnt signaling inhibitor Dkk-1 by qPCR. n = 4 each. Error bars, S.E.

