

Background: Little is known about the molecular and metabolic impact of agmatine consumption.
Results: We scrutinized the impact of long term agmatine treatment on whole body metabolic profiling and gene expression in rats. Agmatine elevated [cAMP] and triggered widespread changes in gene expression and metabolomic profiling.
Conclusion: Agmatine influences on metabolism may be mediated via cAMP-PKA.
Significance: Agmatine may curtail the metabolic and hormonal derangements associated with obesity.
Keywords: Adenylate Cyclase (Adenylyl Cyclase), Carbohydrate Metabolism, Carnitine, Cyclic AMP (cAMP), Fatty Acid Oxidation, Insulin Resistance, Liver, Metabolic Syndrome
Abstract
Agmatine (AGM), a product of arginine decarboxylation, influences multiple physiologic and metabolic functions. However, the mechanism(s) of action, the impact on whole body gene expression and metabolic pathways, and the potential benefits and risks of long term AGM consumption are still a mystery. Here, we scrutinized the impact of AGM on whole body metabolic profiling and gene expression and assessed a plausible mechanism(s) of AGM action. Studies were performed in rats fed a high fat diet or standard chow. AGM was added to drinking water for 4 or 8 weeks. We used 13C or 15N tracers to assess metabolic reactions and fluxes and real time quantitative PCR to determine gene expression. The results demonstrate that AGM elevated the synthesis and tissue level of cAMP. Subsequently, AGM had a widespread impact on gene expression and metabolic profiling including (a) activation of peroxisomal proliferator-activated receptor-α and its coactivator, PGC1α, and (b) increased expression of peroxisomal proliferator-activated receptor-γ and genes regulating thermogenesis, gluconeogenesis, and carnitine biosynthesis and transport. The changes in gene expression were coupled with improved tissue and systemic levels of carnitine and short chain acylcarnitine, increased β-oxidation but diminished incomplete fatty acid oxidation, decreased fat but increased protein mass, and increased hepatic ureagenesis and gluconeogenesis but decreased glycolysis. These metabolic changes were coupled with reduced weight gain and a curtailment of the hormonal and metabolic derangements associated with high fat diet-induced obesity. The findings suggest that AGM elevated the synthesis and levels of cAMP, thereby mimicking the effects of caloric restriction with respect to metabolic reprogramming.
Introduction
Agmatine, a product of arginine decarboxylation, was first discovered in mammalian brain in 1994 (1). Thereafter, numerous investigations suggest that AGM2 may act as a hormone affecting multiple metabolic and physiological functions including having neuromodulatory and neuroprotective effects, functioning as an endogenous ligand for imidazoline receptors, serving as an antioxidant and promoter of mitochondrial function, exercising an anticancer effect and inhibition of polyamine biosynthesis, conferring protection against energy stress, and potently inhibiting inducible NO synthesis (for a review, see Ref. 2). However, no study has focused on possible mechanisms of AGM action or its impact on whole body metabolomic profiling and gene expression. In addition, little is known about the potential benefits and risks of long term AGM consumption. For example, no information is available about the impact of long term AGM consumption on hepatic metabolism including fatty acid oxidation (FAO), gluconeogenesis, glycolysis, and ureagenesis. This issue is especially important because the liver has a key role in whole body carbohydrate, nitrogen, and lipid metabolism (3–5).
Our previous investigation indicates that AGM increases cellular [cAMP] (3, 6). This finding led to the hypothesis that AGM may have a widespread influence on whole body metabolic profiling by elevating the intracellular cAMP level. cAMP generated at the plasma membrane diffuses to different subcellular compartments and influences cellular function by either activating protein kinase A (PKA) or cAMP-regulated guanine nucleotide exchange signaling factors (Epac1 and Epac2) (7–10). One of the many metabolic functions known to be impacted by cAMP signaling is the activation of gene expression and its action on both the peroxisomal proliferator-activated receptor-α (PPARα) and its coactivator, PGC1α. The PPAR family includes three members, α, β, and γ, encoded by genes belonging to the nuclear receptor superfamily and exhibiting distinct tissue distribution (10–13). The transcriptional activity of PPARα is enhanced by several coactivators, including PGC1α and -1β. These coactivators are required for the ability of PPARα to maximally increase gene transcription (12–15), thereby turning on downstream target genes such as those involved in carnitine (Car) biosynthesis and selected organic cation transporters (OCTN1 and OCTN2) (16–19). Activation of genes responsible for Car biosynthesis and transport is expected to have a significant impact on FAO and carbohydrate metabolism. Car facilitates the translocation of long chain fatty acids from the cytosol into the mitochondrial matrix for subsequent β-oxidation. This translocation is mediated via Car-acyltransferase, Car-acylcarnitine translocase, and Car-palmitoyltransferase (15, 16). In addition, Car and its acylcarnitine (AcylCar) esters are essential metabolites that have a number of indispensable functions in bioenergetics, mitochondrial function, and intermediary and carbohydrate metabolism (15, 16, 20, 21).
Here, we examined the possibility that AGM, secondary to increasing the synthesis and levels of cAMP, may stimulate one or more members of the PPAR gene family, thereby activating downstream target genes such as genes involved in Car biosynthesis and transport. We scrutinized (i) the metabolic function(s) and gene expression that are influenced by AGM and (ii) the potential benefits and risks of AGM consumption in normal and disease states such as in the case of high fat diet (HFD)-induced obesity. The present study provides the first comprehensive insight into the impact of AGM on whole body metabolic profiling and gene expression.
MATERIALS AND METHODS
Study Protocol
We performed a long term in vivo study in growing male Sprague-Dawley rats (Charles River) that were fed an HFD (60% kcal from fat), (Research Diets catalog number D12492) compared with standard chow diet (SD; 10% kcal from fat). To this end, rats (body weight, 50–55 g) were divided into four groups given (a) HFD and water, (b) HFD with drinking water containing 0.1% (1 g/liter) AGM (HFD + AGM), (c) SD and water, and (d) SD with drinking water containing 0.1% AGM (SD + AGM). Body weight, food, and water intake were measured throughout the study. These feeding regimens and AGM treatment were continued for either 4 (n = 6 in each study group) or 8 weeks (n = 4 in each study group). 24 h before completion of the feeding protocol (as above), urine was collected. Rats were fasted overnight and 30 min before sacrificing were given via tail vein a single injection of a solution containing 50 mg/kg sodium [U-13C]acetate plus 10 mg/kg 15NH4Cl to trace the acetyl-CoA-generating processes such as glycolysis and FAO and to determine the influence of AGM on various metabolic pathways including the TCA cycle, gluconeogenesis, and ureagenesis. Then rats were sacrificed, and blood was collected into tubes containing heparin. Immediately thereafter, forebrain, liver, biceps femoris (a representative muscle), and epididymal white adipose and kidney tissues were isolated, clamped, and snap frozen in liquid nitrogen.
A separate group of rats given SD or SD + AGM for 4 weeks was used to prepare isolated hepatocytes as we described (22). Incubations were carried out for 60 min at 37 °C in a shaking water bath with Krebs buffer (pH 7.4) containing 1 mm glutamine, 0.3 mm NH4Cl, and either (i) 10 mm [1-13C]lactate plus 1.5 mm [1-13C]pyruvate, (ii) 10 mm [3-13C]lactate plus 1.5 mm [3-13C]pyruvate, (iii) 0.5 mm [U-13C]palmitate, or (iv) 5 mm [U-13C]glucose. A separate series of incubations was performed with 1 mm [5-15N]glutamine, 0.3 mm 15NH4Cl, and unlabeled 1.5 mm pyruvate and 10 mm lactate. At the end of incubation with 13C-labeled precursor, an aliquot (200 μl) was taken for measuring the release of 13CO2. Immediately thereafter, incubation was stopped with HClO4. Metabolite measurements were done in neutralized tissue extracts (3, 22). A separate series of incubations was carried out in medium as described (23) to determine the activity of γ-butyrobetaine dioxygenase (γ-BBD), the enzyme that catalyzes the last step of Car synthesis (23, 24). Incubations at 37 ºC were stopped after 30 min by addition of 1 ml of methanol.
Measurements
LC/MS/MS, GC-MS, and NMR Methodology
A neutralized perchloric acid extract prepared from various tissues was used for measurement of 13C enrichment in the indicated metabolites and intermediates. Measurement was performed on either an Agilent Triple Quad 6410 mass spectrometer combined with an Agilent LC 1260 Infinity or Hewlett-Packard 5971 Mass Selective Detector coupled with a 5890 HP-GC, GC-MS Agilent System (6890 GC-5973 Mass Selective Detector) or a Hewlett-Packard HP-5970 Mass Selective Detector using electron impact ionization with an ionizing voltage of −70 eV and an electron multiplier set to 2000 V as described previously (22). Levels of free Car and Car/AcylCar profiling both in blood and various tissues were determined using tandem mass spectrometry as described (23, 25).
Measurements of 13CO2 release following incubation of isolated hepatocytes were performed by isotope ratio mass spectrometry (3, 22). The concentration of hepatic N-acetylglutamate (NAG) was determined as indicated (3, 26). The production of 15N-labeled urea isotopomers (containing one or two 15N atoms) from 15NH4Cl and its presence in the plasma were determined as described (27).
To further evaluate the action of AGM on hepatic lipid and metabolite composition, a portion of the frozen liver was extracted with chloroform-methanol to analyze the lipid profile using 1H NMR, 13C NMR, or 31P NMR as we described (3). To determine the impact of AGM on the urinary metabolic profile, the 24-h urine collection was analyzed by 1H NMR (28).
Enzyme Assays and Other Measurements
The activity of adenylyl cyclase (ADCY) was measured ex vivo in a plasma membrane suspension prepared from liver homogenate. Incubations of 20 μl of membrane suspension were carried out for 5, 10, and 15 min as described (29). The activity of ADCY was determined by measuring the concentration of newly synthesized cAMP. The level of cAMP in the tissue was determined as described (3, 6) using an enzyme immunoassay according to the manufacturer's protocol (Cayman Chemical enzyme immunoassay kit). The relative lipid mass in the liver or muscle tissues was measured using Folch extraction (30). The concentration of amino acids was determined with an Agilent 1260 Infinity LC system utilizing precolumn derivatization with o-phthalaldehyde (3, 22). The levels of ammonia, urea, ATP, ADP, and AMP were measured as described (3, 22). We also measured the level of lactate, pyruvate, acetoacetate, β-OH-butyrate (ketone bodies), malate, and glucose (3, 22). Triglycerides (TG) or free fatty acids in plasma or tissues were assayed with the InfinityTM triglyceride reagent kit or Biovision kit, respectively. Plasma insulin, glucagon (31), leptin, and adiponectin were determined using ELISA kits. Tissue protein was determined by Coomassie Blue (Thermo Scientific).
Transcriptional Profiling Using RT-Quantitative Polymerase Chain Reaction (PCR)
Total RNA was isolated from the indicated tissues using the TRIzol (Invitrogen) method. RNA concentration and purity were estimated from the optical density at 260 nm. The reverse transcription reaction and quantitative real time PCR (Applied Biosystems SYBR Green Master Mix kit) were used to explore the expression of genes relevant to the metabolic pathways studied here and were performed as described (31). Quantification of gene expression was performed relative to control (SD) using GAPDH as an internal reference as indicated (32). The sequences of primers used are as indicated in Table 1.
TABLE 1.
Characteristics of the primers used for real time polymerase chain reaction
TMLD, TML dioxygenase; TMABA-DH, 4-trimethylaminobutyraldehyde dehydrogenase.
| Gene | Forward primer (5′ to 3′) | Reverse primer (5′ to 3′) | NCBI GenBankTM accession number |
|---|---|---|---|
| GAPDH | GCATGGCCTTCCGTGTTGC | GGGTGGTCCAGGGTTTCTTACTC | NM_017008 |
| UCP1 | AATCAGCTTTGCTTCCCTCA | TTTGTGCTTGCATTCTGACC | NM_012682 |
| UCP2 | ATGACAGACGACCTCCCTTG | GAAGGCATGAACCCCTTGTA | NM_019354 |
| UCP3 | GAGAACCCAGGAGTGCAGAG | GGGGGTGTAGAACTGCTTGA | NM_013167.2 |
| TMLD | GCCCTGTGGCATTCAAGTAT | GGTCCAACCCCTATCATGTG | NM_133387 |
| TMABA-DH | TTTGAGACTGAAGCCGAGGT | CACCGGGCTGACGTTATAGT | NM_022273 |
| γ-BBD | ATTCTGCAAAAGCTCGGAAA | CTCCTTGGAGTCCTGCTCTG | NM_022629 |
| OCTN1 | CCTCTCTGGCCTGATTGAAG | CTCCGCTGTGAAGACGTACA | NM_022270 |
| OCTN2 | AGCATTTGTCCTGGGAACAG | ACTCAGGGATGAACCACCAG | NM_019269 |
| ADCY5 | CGAGGTCTCCCAGAGACAAG | TGTCAGCAAACAGGATGCTC | NM_022600.1 |
| ADCY6 | GGATCTTCCTTTTGCTGCTG | GTCCTCAGTGGGGTGTGACT | NM_001270785.1 |
| CREB | TCAGCCGGGTACTACCATTC | CCTCTCTCTTTCGTGCTGCT | NM_031017 |
| PGC1α | CGATGACCCTCCTCACACCA | TTGGCTTGAGCATGTTGCG | NM_031347 |
| PPARα | CCCTCTCTCCAGCTTCCAGCCC | CCACAAGCGTCTTCTCAGCCATG | NM_013196 |
| PPARγ | CCCTGGCAAAGCATTTGTAT | ACTGGCACCCTTGAAAAATG | NM_001145366 |
Calculation and Statistical Analyses
13C enrichment in 13C-labeled mass isotopomers is expressed as molar percent enrichment, which is the mol fraction (%) of analyte containing 13C atoms above natural abundance. The molar percent enrichment of individual 13C-labeled mass isotopomers (containing i 13C atoms; for example, in the case of glutamate, i = 1–5; for citrate, i = 1–6, etc.) was calculated as described (22, 33). The level of 13C-labeled mass isotopomer was calculated as the product of (Molar percent enrichment/100) × Concentration (nmol/g of wet weight) and is expressed as nmol of 13C metabolite/g of wet weight. The output of 13CO2 (nmol/g) was calculated as the product of 13CO2 enrichment: ((Atom % excess)/100) × Concentration of NaHCO3 in the incubation medium (22). The level of plasma 15N-labeled urea isotopomers was calculated as indicated (27).
Statistical analysis was carried out using Prism 5 software for the Macintosh. A t test or analysis of variance test was used to compare two groups or differences among groups as needed. Data are presented as mean ± S.D. p < 0.05 is considered statistically significant.
RESULTS
AGM Consumption and Metabolism
The average AGM consumption was 55–75 mg/kg of body weight/day between days 20 and 55 of the study protocol (Fig. 1a). In muscle, AGM was undetectable; in peripheral plasma, AGM was below 1 nmol/ml as determined by HPLC analysis. AGM was mainly present in the liver and the kidney (Fig. 1b). There was higher AGM (p < 0.03) in the liver of the SD + AGM study group compared with the HFD + AGM study group but higher AGM (p < 0.02) in the kidney of HFD + AGM compared with SD + AGM (Fig. 1b). This may reflect a diminishing AGM uptake in fatty liver induced by HFD but higher uptake and accumulation in the kidney. AGM was not detected in the urine, but its metabolite, γ-guanidinobutyric acid, was excreted in the urine (not shown). γ-Guanidinobutyric acid is formed in various tissues via diamine oxidase (2).
FIGURE 1.

Agmatine consumption, calorie intake, and body weight during the course of the study. a represents the daily consumption of agmatine. b represents the amount of agmatine in the liver or kidney at the end of 4 or 8 weeks of consumption as in a. c represents the daily caloric intake. d represents the changes in body weight during the course of SD or HFD with or without agmatine. Error bars represent means ± S.D. of six rats between 0 and 32 days and four rats in each experimental group between 32 and 56 days.
Impact on Plasma Hormones and Metabolite Profiling
Because plasma metabolic profiling mirrors body metabolic status, we first determined the impact of AGM on selected hormones and metabolite levels in the plasma. AGM increased the plasma glucagon level and the glucagon/insulin molar ratio regardless of the diet (Fig. 2, b and c). HFD increased plasma insulin and leptin and decreased adiponectin, but AGM reversed the HFD-induced hormonal derangements (Fig. 2, a, d, and e). Plasma free fatty acids were significantly decreased in SD + AGM and marginally decreased in the HFD + AGM group (p = 0.08–0.12) (Fig. 2g). Triglycerides, cholesterol, and glucose were modestly decreased by AGM (Fig. 2). Similarly, plasma lactate and citrate levels were marginally decreased (data not shown), and amino acid levels showed only small changes with AGM (data not shown).
FIGURE 2.

Plasma hormone and metabolite levels. a–i, measurements were performed in plasma of rats after 4 weeks on SD, SD + AGM, HFD, or HFD + AGM. Error bars represent mean ± S.D. (n = 5–6 rats; for glucagon or glucagon/insulin ratio, n = 4 rats). P1, significantly different from SD; P2, significantly different from HFD.
Influence on Body Weight Gain and Tissue Fat or Protein Mass
The consumption of AGM resulted in about a 15% reduction in body weight (BW) gain between 30 and 55 days in HFD + AGM or SD + AGM compared with the HFD or SD study group, respectively (Fig. 1d). The changes in BW were not a result of decreased calorie intake, which was similar with or without AGM (Fig. 1c). To examine whether the AGM-induced decrease in BW gain is due to changes in body fat or protein composition, we determined fat and protein content in the liver and muscle. Data in Fig. 3 demonstrate that in rats given AGM the fraction of protein was significantly higher in liver or muscle. However, the fraction of total lipids was decreased by about 20–25% in the liver regardless of the diet (Fig. 3b). In muscle, the fraction of lipids was decreased by about 35% in SD + AGM and 20% in the HFD + AGM group (Fig. 3f). Similarly, the tissue levels of free fatty acids and TG (Figs. 3 and 4) and the epididymal fat area (data not shown) were decreased by AGM consumption. The diminished lipid accumulation in tissues is in agreement with reduced plasma leptin and elevated adiponectin levels (Fig. 2) and in accord with previous observations indicating an increased adiponectin/leptin ratio associated with increased FAO and reduced lipid mass in peripheral tissues (34). Taken together, the data suggest that AGM increased tissue protein and reduced BW gain mainly due to lower fat mass.
FIGURE 3.

Protein and fat mass in the liver and muscle. a–h, measurements were performed in freeze clamped tissue obtained from rats after 4 weeks on SD, SD + AGM, HFD (FD), or HFD + AGM. Error bars represent mean ± S.D. (n = 5–6 rats). P1, significantly different from SD; P2, significantly different from HFD.
FIGURE 4.

A representative 13C NMR analysis of hepatic lipids. 13C NMR spectra of hepatic lipid extract from rats after 4 weeks on SD, SD + AGM, HFD, or HFD + AGM are shown. These spectra demonstrate a remarkable reduction in TG and fatty acids in the liver of rats that received AGM. Spectra were obtained using a Bruker Avance IIITM 400 wide bore and TopspinTM 3.0 software. The chemical shifts were determined relative to the resonance of trimethylsilylpropionic acid. Peak assignments are as follows: TG C2′, carbon 2 of glycerol in TG; TG C1′3′, carbons 1 and 3 of glycerol in TG; -N(CH3)3, trimethylammonium group in phosphatidylcholine and sphingomyelin; C2, carbon α to carbonyl in fatty acids; ω-2, carbon β to end chain CH3 in fatty acids; (CH2)n, bulk of CH2 groups in fatty acids; ω-1, carbon α to end chain CH3 in fatty acids; ω, end chain CH3 in fatty acids.
The diminished fat mass may be a consequence of enhanced fat oxidation coupled with increased energy expenditure and metabolic rate. Increased energy expenditure by elevated expression of uncoupling proteins (UCPs) is thought to promote weight loss (35–37) and may thus contribute to decreased BW gain induced by AGM. Here, we determined the impact of AGM on expression of UCP genes in the liver, muscle, and epididymal white adipose tissue (eWAT). RT-PCR analysis demonstrates increased expression of UCP2 and UCP3 in the liver (Fig. 5, a and b), muscle (Fig. 5, c and d), and eWAT (Fig. 5, e and f) of rats given AGM. However, we were unable to detect the expression of UCP1. The reason for undetectable UCP1 could be that there is very little or a lack of brown adipose tissue where UCP1 is exclusively expressed and where it is responsible for thermogenesis (37). UCP2 and UCP3 are homologs of UCP1, although it is not clear whether they can dissipate metabolic energy as heat as does UCP1 (35–37). Nonetheless, the increased expression of UCP2 and UCP3 coupled with decreased fat mass and weight gain despite equal calorie intake with the HFD suggests that AGM may elevate fat oxidation and metabolic rate.
FIGURE 5.
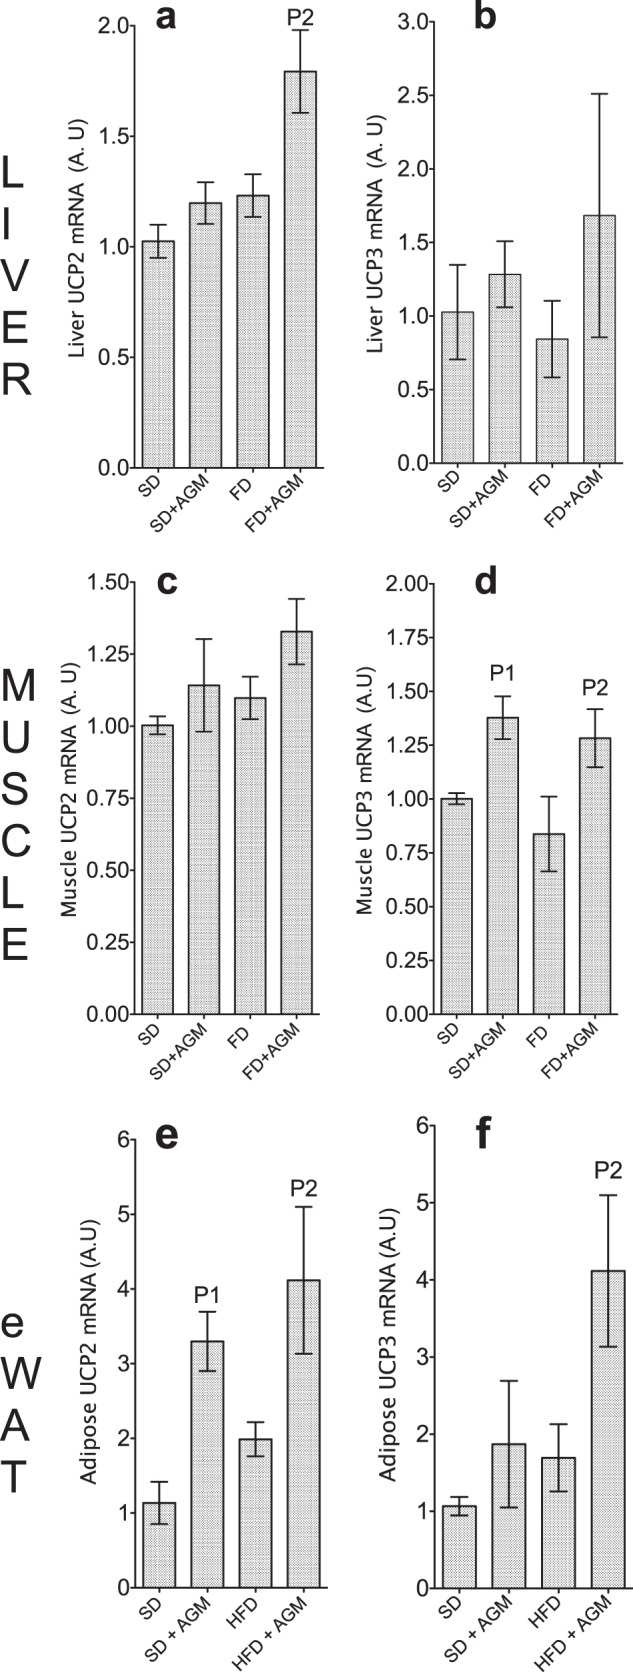
The expression of UCP2 and UCP3 genes. a–f, mRNA expression was determined in the liver, muscle, and eWAT by RT-PCR with GAPDH as an internal control (31). Levels of mRNA (in arbitrary units (A.U)) were calculated relative to SD. Error bars represent means ± S.D. (n = 4–6 rats). P1, significantly different from control (SD); P2, significantly different from HFD (FD).
Impact on Carnitine/Acylcarnitine Status and Resulting Fat Oxidation
Numerous genes and modulators may mediate the reduction of fat mass via increased fat oxidation. Among the many modulators, Car has a key role in oxidation of long chain fatty acids, the transport of which from the cytosol into the mitochondrial matrix for subsequent β-oxidation is Car-dependent (16, 20, 21). Therefore, to examine whether the AGM-induced reduction of tissue fat is related to improved Car/AcylCar status, we determined the Car and AcylCar profiling in plasma and various tissues. After 4 weeks of AGM consumption, there was a significant increase in the free Car level in the plasma (Fig. 6), liver, muscle, and kidney (Table 2). A similar improvement of both free Car and AcylCar was seen after 8 weeks of AGM treatment in plasma and various tissues (data not shown). AGM decreased the level of medium and long chain AcylCars (for example C6 to C20) but significantly increased the short chain AcylCars (C2, C3, and C4; Fig. 6 and Table 2). The medium to long chain AcylCars are mainly derived from FAO, and the C2 to C5 AcylCars are mainly derived from oxidation of amino or organic acids. Hence, the current observations suggest that AGM improved fat oxidation and diminished incomplete FAO.
FIGURE 6.

Tandem mass spectrometry-based analysis of the plasma Car/AcylCar profiling after 4 weeks of agmatine consumption. a–n, measurements were performed in plasma of rats after 4 weeks on SD, SD + AGM, HFD, or HFD + AGM. Error bars represent means ± S.D. (n = 5–6 rats in each study group). P1, significantly different from SD; P2, significantly different from HFD.
TABLE 2.
Tandem mass spectrometry-based analysis of carnitine/AcylCar in tissue
Measurements were performed in the indicated tissue of rats after 4 weeks on SD, HFD, SD + AGM, or HFD + AGM. Levels are means ± S.D. (n = 5–6 rats in each study group).
| SD | SD + AGM | HFD | HFD + AGM | |
|---|---|---|---|---|
| nmol/g wet weight | nmol/g wet weight | nmol/g wet weight | nmol/g wet weight | |
| Liver | ||||
| Free carnitine | 317 ± 26 | 396 ± 42a | 267 ± 41 | 385 ± 33b |
| C2-AcylCar | 206 ± 27 | 329 ± 37a | 221 ± 32 | 319 ± 47b |
| C3-AcylCar | 15 ± 1.8 | 19.6 ± 1.7a | 13.8 ± 3.8 | 16 ± 1.7 |
| C4-AcylCar | 5.2 ± 0.7 | 8.9 ± 1.1a | 3.3 ± 0.3 | 4.7 ± 0.7b |
| C12-AcylCar | 2.2 ± 0.4 | 1.4 ± 0.3 | 2.3 ± 0.5 | 1.2 ± 0.2 |
| C14-AcylCar | 3.5 ± 0.4 | 2.9 ± 0.4 | 4.4 ± 0.8a | 2.2 ± 0.6b |
| C16-AcylCar | 11.7 ± 2.6 | 8.5 ± 1.6 | 12.6 ± 2.7 | 5.8 ± 1.1b |
| C18:0-AcylCar | 3.9 ± 1.4 | 2.4 ± 0.8 | 5.2 ± 0.7b | 4.3 ± 0.9 |
| C18:1-AcylCar | 5.8 ± 0.9 | 6.1 ± 0.8 | 5.8 ± 1.1 | 4.4 ± 0.7 |
| C18:2-AcylCar | 2.5 ± 0.4 | 2.1 ± 0.3 | 1.7 ± 0.3 | 1.9 ± 0.6 |
| Muscle | ||||
| Free carnitine | 730 ± 22 | 1131 ± 62a | 780 ± 19 | 977 ± 47b |
| C2-AcylCar | 244 ± 11 | 383 ± 36a | 238 ± 20 | 332 ± 32b |
| C3-AcylCar | 3.1 ± 0.3 | 3.3 ± 0.1 | 2.7 ± 0.2 | 3.4 ± 0.2 |
| C4-AcylCar | 6.5 ± 0.6 | 6.9 ± 0.6 | 5.3 ± 0.5 | 6.1 ± 0.7 |
| C12-AcylCar | 2.9 ± 0.4 | 2.2 ± 0.3 | 5.5 ± 0.6a | 4.3 ± 0.2 |
| C14-AcylCar | 6.1 ± 0.7 | 5.2 ± 0.6 | 10.1 ± 0.6a | 7.3 ± 0.9b |
| C16-AcylCar | 18.3 ± 2.2 | 15.8 ± 2.6 | 26.1 ± 2.6a | 22 ± 3.1 |
| C18:0-AcylCar | 3.6 ± 0.7 | 3.4 ± 0.5 | 9.7 ± 0.3a | 8.3 ± 0.6 |
| C18:1-AcylCar | 16.3 ± 2.7 | 12.2 ± 2.6 | 19.8 ± 1.6 | 16.1 ± 1.1 |
| C18:2-AcylCar | 7.3 ± 1.1 | 5.4 ± 1.6 | 14.4 ± 0.9a | 10.9 ± 0.8 |
| Kidney | ||||
| Free carnitine | 374 ± 22 | 513 ± 52a | 442 ± 25 | 450 ± 27 |
| C2-AcylCar | 213 ± 13 | 266 ± 12a | 171 ± 7.8a | 233 ± 9b |
| C3-AcylCar | 10.3 ± 0.9 | 12.3 ± 2.3 | 8.8 ± 1.2 | 8.5 ± 1.1 |
| C4-AcylCar | 10.7 ± 1.1 | 12.5 ± 1.2 | 8.3 ± 1.5 | 6.6 ± 0.3 |
| C12-AcylCar | 1.7 ± 0.2 | 1.7 ± 0.2 | 1.9 ± 0.4 | 0.8 ± 0.1b |
| C14-AcylCar | 2.1 ± 0.4 | 2.1 ± 0.5 | 2.9 ± 0.3 | 1.6 ± 0.1b |
| C16-AcylCar | 6.3 ± 0.9 | 7.8 ± 0.5 | 9.1 ± 0.6a | 6.2 ± 0.3b |
| C18:0-AcylCar | 2.1 ± 0.4 | 1.9 ± 0.1 | 2.9 ± 0.4 | 2.0 ± 0.2 |
| C18:1-AcylCar | 3.6 ± 0.4 | 2.7 ± 0.5 | 4.3 ± 0.4a | 3.2 ± 0.2b |
| C18:2-AcylCar | 1.6 ± 0.2 | 1.8 ± 0.2 | 3.9 ± 0.4a | 2.3 ± 0.1b |
a Significantly different from SD.
b Significantly different from HFD.
The decreased medium chain AcylCar is especially important with regard to C14-AcylCar (myristoyl carnitine), which is increased in obesity, metabolic syndrome, and insulin resistance (38, 39). AGM significantly decreased myristoyl-Car in plasma and muscle (Fig. 6 and Table 2) and marginally decreased this species in liver (Table 2). Furthermore, AGM reversed the HFD-induced decrease of free Car in plasma (Fig. 6) and muscle (Table 2). It is well established that chronic HFD feeding or genetically induced diabetes impairs carnitine status (21), possibly due to a disruption of gene activity involved in Car biosynthesis and transport (40). The AGM-induced improvement of the Car level in HFD together with increased acetylcarnitine (C2) and reduction of long and medium chain acylcarnitines suggests that AGM enhanced FAO and diminished incomplete FAO. The latter is a near universal complication in obesity and metabolic syndrome associated with insulin resistance and type 2 diabetes (20, 21, 38). The current finding suggests that AGM may be a useful agent to improve body Car status in obesity and metabolic syndrome.
The elevation of Car would be expected to improve β-oxidation. To directly examine this possibility, we used 13C-labeled acetate to trace the products of FAO. The injected [U-13C]acetate is expected to be metabolized to [U-13C]acetyl-CoA via acetyl-CoA synthetase and then to acetylcarnitine and/or ketone bodies (KB). As illustrated in Fig. 7, top panel, changes in 13C enrichment in acetylcarnitine or KB will reflect changes in the generation of unlabeled acetyl-CoA via various pathways such as FAO, glycolysis, and oxidation of organic or amino acids. We found that the plasma (Fig. 6) and tissue level (Table 2) of C2-AcylCar was increased following AGM consumption. Measurements of KB in plasma and tissues showed only modest changes with AGM consumption (data not shown). However, the fraction of 13C-labeled C2-AcylCar or KB was significantly decreased in the plasma and tissue following AGM consumption (Fig. 7). This decrease was more significant in the HFD group, indicating that AGM supplementation led to a significantly higher generation of unlabeled acetyl-CoA. To determine whether increased FAO is responsible for the increased generation of unlabeled acetyl-CoA and KB, we measured FAO in isolated hepatocytes obtained from rats treated with or without AGM and incubated with [U-13C]palmitate. Fig. 7 demonstrates a significantly higher release of 13CO2 and generation of 13C-labeled KB in hepatocytes obtained from rats given AGM compared with rats without AGM, indicating that AGM stimulates FAO. Together, the data demonstrate that AGM improved Car status and augmented FAO.
FIGURE 7.

Impact of AGM on fat oxidation and generation of C2-acylcarnitine and KB. The top panel illustrates the potential sources of C2-acylcarnitine and KB that are expected to dilute the 13C enrichment (molar percent enrichment (MPE)) of C2-acylcarnitine and KB derived from the injected [U-13C]acetate. As unlabeled acetyl-CoA forms from various sources, a greater dilution of 13C-labeled metabolites occurs. GC-MS measurements were performed in plasma, muscle, and liver after 4 weeks on SD, SD + AGM, HFD, or HFD + AGM. 13C2-acylcarnitine is the M2 isotopomer (contains two carbons labeled with 13C). ΣM2,M4 13C-labeled ketone bodies represent the sum of M2 and M4 isotopomers of KB. Error bars represent means ± S.D. (n = 5–6 in each experimental group). The bottom panels represent experiments with isolated hepatocytes obtained from rats given SD or SD + AGM for 4 weeks. Incubations were performed with [U-13C]palmitate. Error bars represent means ± S.D. of three to four independent experiments with hepatocytes obtained from three to four rats in each group. P1, significantly different from SD; P2, significantly different from HFD.
Impact on Genes Responsible for Carnitine Biosynthesis and Transport
Car is synthesized mainly in the liver and kidney from trimethyllysine (TML) released during proteolysis (24). In an attempt to reveal the cause of the AGM-induced increase in body Car, we determined the expression of the primary genes responsible for Car biosynthesis in the liver and kidney. Data in Fig. 8 demonstrate that AGM significantly increased both hepatic and renal expression of TML dioxygenase (TMLD), 4-trimethylaminobutyraldehyde dehydrogenase (TMABA-DH), and γ-BBD. To determine whether the increased gene expression is translated into enzyme activity, we measured ex vivo the activity of γ-BBD in the liver homogenate. Fig. 8g demonstrates a remarkably higher activity of γ-BBD and Car synthesis in liver homogenate prepared from rats that consumed AGM. Similar results were achieved in isolated hepatocytes obtained from rats given 0.1% AGM in their drinking water for 4 weeks compared with rats without AGM (Fig. 8h). Hence, the data suggest that AGM up-regulates the expression of genes responsible for Car biosynthesis.
FIGURE 8.

The impact of AGM on gene expression and enzyme activity of carnitine biosynthesis. The top panel represents the various steps in Car biosynthesis and the genes involved. Carnitine biosynthesis consists of four distinct enzymatic reactions. The TML generated from proteolysis is oxidized by TML dioxygenase (TMLD), 3-hydroxy-TML aldolase (HTMLA), and 4-trimethylaminobutyraldehyde dehydrogenase (TMABA-DH) to form γ-butyrobetaine. The last step is hydroxylation of γ-butyrobetaine by γ-BBD to form carnitine (24). Measurements were performed in rat tissues after 4 weeks on SD, SD + AGM, HFD, or HFD + AGM. For determination of gene expression, we used RT-PCR with GAPDH as an internal control. Levels of mRNA (arbitrary units (A.U)) were calculated relative to SD. Panel g represents the ex vivo determination of γ-BBD activity using a separate portion of the freeze clamped liver that was also used for determination of gene expression (as in a–c). Panel h represents the activity of γ-BBD in isolated hepatocytes obtained from rats given SD or SD + AGM for 4 weeks. For in vivo measurements, error bars represent means ± S.D. of four to six rats in each experimental group (a–f). P1, significantly different from control (SD); P2, significantly different from HFD. In experiments with isolated hepatocytes, error bars represent means ± S.D. of three to four independent incubations of hepatocytes obtained from three to four rats. P1, significantly different from control (SD).
Car biosynthesis is very limited or absent in muscle (24). Therefore, the AGM-induced increase in the muscle Car level in the HFD + AGM group (Table 2) must be mediated via increased Car import. Similarly, the increased plasma Car level must depend upon Car export from liver and/or kidney, the major organs of Car synthesis. The distribution of Car within the body is controlled by the organic cation transporters (OCTN1 and OCTN2), which determine both the tissue level and intestinal absorption of Car (18, 24, 41, 42). To examine the impact of AGM on Car transporters, we determined the expression of OCTN1 and OCTN2 genes in the liver, muscle, and kidney. Data in Fig. 9 demonstrate a significantly increased expression of OCTN1 and OCTN2 in kidney and liver of SD + AGM and HFD + AGM groups, a significantly increased OCTN1 and OCTN2 expression in the muscle of the HFD + AGM group, and a near significant (p = 0.07–0.1) increase in the SD + AGM group. OCTN2 is responsible for Car transport across the plasma membrane, whereas OCTN1 has relatively low Car transport activity and is more prominent in the mitochondrial membrane than in the plasma membrane (42). The significance of OCTN1 up-regulation by AGM may be to satisfy the increased demand for Car when the rate of β-oxidation capacity is increased, as demonstrated in Fig. 7.
FIGURE 9.
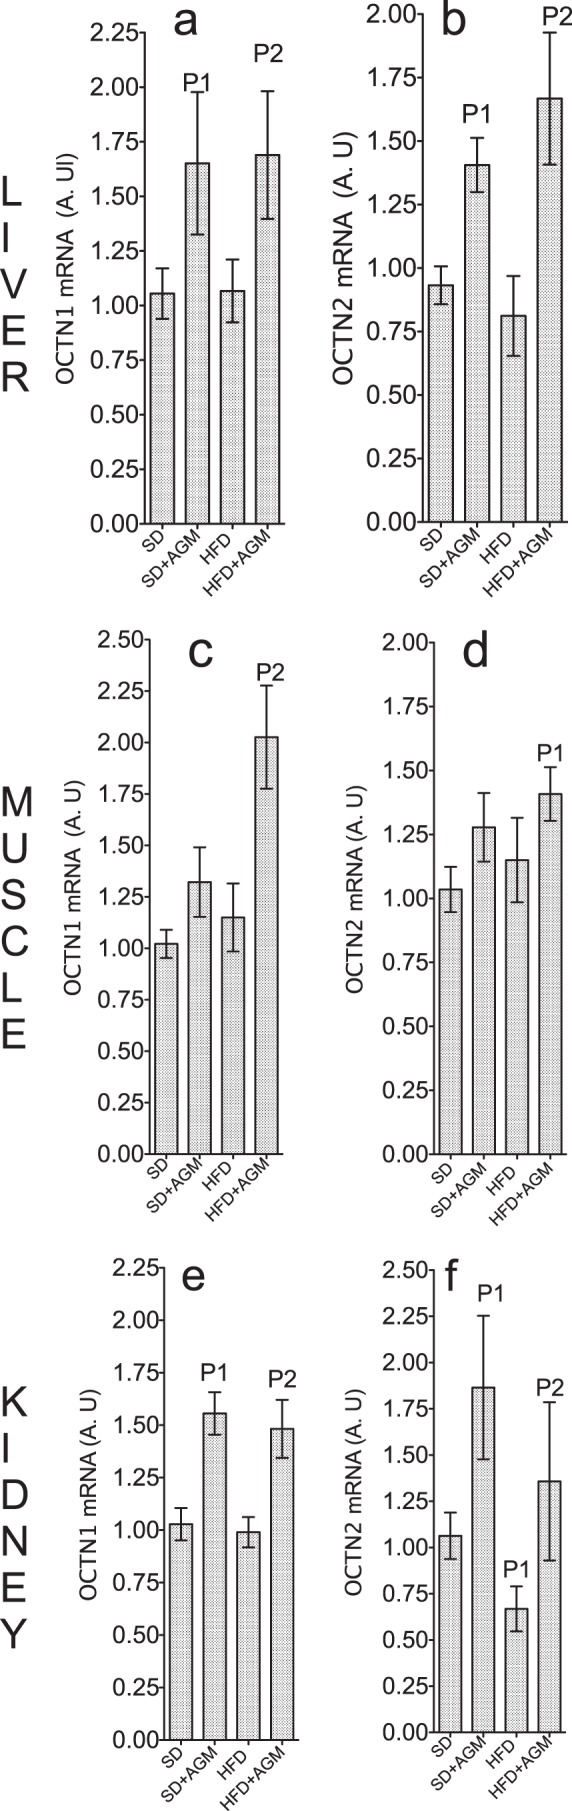
Agmatine up-regulates the genes responsible for carnitine transport in the body. We determined gene expression of the organic cation transporters (OCTN1 and OCTN2) in the liver (a and b), muscle (c and d), and kidney (e and f) by RT-PCR using GAPDH as an internal control. Measurements were performed in rats after 4 weeks on SD, SD + AGM, HFD, or HFD + AGM. Levels of mRNA (arbitrary units (A.U)) were calculated relative to SD. Error bars represent means ± S.D. of four to six rats in each group. P1, significantly different from control (SD); P2, significantly different from HFD.
Influence on Hepatic Gluconeogenesis and Glycolysis
As illustrated in Fig. 7, top panel, in addition to FAO, a significant amount of acetyl-CoA may be derived from glycolysis and the metabolism of amino or organic acids. To address this possibility, we examined the action of AGM on hepatic carbohydrate and organic acid metabolism. The liver plays a key role in whole body glucose homeostasis and is a central organ responsible for gluconeogenesis (4, 33, 43). Data in Fig. 10 indicate little change in hepatic glucose and pyruvate following AGM consumption, whereas the lactate level decreased, especially in the HFD + AGM groups (Fig. 10c). We noted a modest citrate increase in the SD + AGM and HFD + AGM groups (Fig. 10d) and significantly increased malate in HFD that returned to the control level following AGM consumption (Fig. 10e). The decreased hepatic lactate level may correspond to a higher rate of gluconeogenesis from lactate as well as a decreased rate of glycolysis. This possibility is strongly supported by an almost 3-fold decrease in glycolysis (Fig. 10, f and g) and an increase in gluconeogenesis from lactate/pyruvate (Fig. 10h) in isolated hepatocytes obtained from rats that received AGM for 4 weeks. Also, these findings suggest a minimal contribution of unlabeled acetyl-CoA from glycolysis following AGM consumption, corroborating the above conclusion that most of the unlabeled acetyl-CoA and KB (Fig. 7) were derived via AGM-induced stimulation of FAO.
FIGURE 10.

The influence on hepatic carbohydrate and organic acids metabolism. The top panel illustrates the potential coupling between the hepatic acetyl-CoA pool and the metabolism of lactate, pyruvate, the TCA cycle, gluconeogenesis, and glycolysis. Mal, malate; Cit, citrate; Oxa, oxaloacetate; α-Kg, α-ketoglutarate; Lac, lactate; LDH, lactate dehydrogenase; Pyr, pyruvate; PDH, pyruvate dehydrogenase; PC, pyruvate carboxylase; GDH, glutamate dehydrogenase; G6P, glucose 6-phosphate. a–e represent the levels of total glucose and organic acids in the liver of rats after 4 weeks on SD, SD + AGM, HFD, or HFD + AGM. Metabolite levels were measured in liver extracts prepared from rats following the 4 week dietary regimen as indicated. Metabolite levels are means ± S.D. of five to six rats in each group. f–l represent the metabolism of 13C-labeled precursors in isolated hepatocytes obtained from rats given either SD or SD + AGM for 4 weeks. All incubations were carried out for 60 min as described under “Materials and Methods.” f represents the generation of 13CO2 from [U-13C]glucose via glycolysis. g represents the generation of 13C-labeled lactate from [U-13C]glucose via glycolysis. h represents the sum of 13C-labeled glucose isotopomers production from [1-13C]-labeled pyruvate and lactate via gluconeogenesis. i represents the release of 13CO2 from [1-13C]pyruvate via the pyruvate dehydrogenase reaction. j represents the generation of M1 isotopomer of aspartate from [1-13C]pyruvate via anaplerosis. k represents the release of 13CO2 from [3-13C]pyruvate via the TCA cycle. l represents the generation of the M2 isotopomer (labeled at two carbons) of glutamate from [3-13C]pyruvate via cataplerosis. Error bars in experiments with isolated hepatocytes represent means ± S.D. of three to four independent experiments with hepatocytes obtained from three to four rats in each group. P1, significantly different from SD; P2, significantly different from HFD.
To determine whether AGM acts specifically on gluconeogenesis or whether it also has direct influence on the metabolism of pyruvate via pyruvate dehydrogenase and/or pyruvate carboxylase, we determined flux through pyruvate dehydrogenase, pyruvate carboxylase, or the TCA cycle in isolated hepatocytes obtained from rats treated with AGM for 4 weeks compared with rats without AGM. AGM significantly increased the release of 13CO2 from [1-13C]pyruvate (Fig. 10i), indicating a stimulation of flux through pyruvate dehydrogenase because in this case 13CO2 must have been derived via the pyruvate dehydrogenase reaction (22). This finding is in agreement with a previous report demonstrating increased pyruvate dehydrogenase activity by l-carnitine (45). AGM modestly elevated the flux through pyruvate carboxylase as determined by the formation of the M1 (labeled at only one carbon) isotopomer of aspartate from [1-13C]pyruvate (Fig. 10j). In this case, M1 aspartate is generated via the aspartate-oxaloacetate transaminase reaction. The increased flux through pyruvate dehydrogenase and pyruvate carboxylase was accompanied by stimulated flux through the TCA cycle as indicated by almost 2-fold increased 13CO2 release (Fig. 10k) and generation of M2 (labeled at two carbons) isotopomers of 13C-labeled glutamate (Fig. 10l) from [3-13C]pyruvate. The cataplerosis of glutamate has been intensively used as a marker of flux through the TCA cycle (3, 22, 33). In aggregate, the data suggest that AGM stimulates fluxes through both pyruvate dehydrogenase and pyruvate carboxylase coupled with stimulation of gluconeogenesis and flux through the TCA cycle. The elevated hepatic citrate level following AGM consumption (Fig. 10d) is likely a result of increased cataplerosis through the TCA cycle. In addition, the reversal by AGM of the HFD-induced increase in hepatic malate in the liver (Fig. 10e) may be a result of increased gluconeogenesis. Mitochondrial malate is likely exported to the cytosol and converted initially to oxaloacetate and next to phosphoenolpyruvate by phosphoenolpyruvate carboxykinase, a key enzyme in the process of gluconeogenesis (4, 43, 44, 46). Also, a portion of oxaloacetate generated from malate in the TCA cycle may be converted into phosphoenolpyruvate by mitochondrial phosphoenolpyruvate carboxykinase (4, 43, 46).
Effect on Hepatic Nitrogen Metabolism and Ureagenesis
A unique function of the liver is removing waste nitrogen from the body via ureagenesis (3, 22, 26, 27). Most reports dealing with hepatic metabolism in normal and disease states have overlooked this important hepatic function. In the current study, the synthesis of urea was used as a marker for the impact of AGM on hepatic nitrogen metabolism and detoxification of excess ammonia nitrogen. Data in Fig. 11 demonstrate that AGM significantly decreased blood ammonia (Fig. 11a) and increased total blood urea (Fig. 11b). The latter was mediated by a significantly increased synthesis of 15N-labeled urea from the injected 15NH4Cl (Fig. 11c). Of special importance is the reversal by AGM of the increased blood ammonia and decreased urea levels and ureagenesis in the HFD group (Fig. 11, a, b, and c). This observation indicated that the HFD perturbed ureagenesis likely due to excess hepatic fat accumulation and down-regulation of NAG synthesis. NAG is the exclusive activator of ureagenesis (26). To examine this possibility, we determined the hepatic NAG level. The current findings demonstrate decreased [NAG] in the liver of the HFD group and a significantly higher level in the liver of rats that received AGM (Fig. 11d).
FIGURE 11.

The impact of AGM on waste nitrogen removal via hepatic ureagenesis. The top panel illustrates the coupling between FAO, the acetyl-CoA pool, the TCA cycle, and the synthesis of NAG via N-acetylglutamate synthetase (NAGS) and thereby activation of ureagenesis. Also shown are the generation of ammonia via phosphate-dependent glutaminase (PDG) and the reductive amination of α-ketoglutarate (α-kg) via glutamate dehydrogenase (GDH). NAG activates the carbamoyl-phosphate synthetase-I (CPS-1) to form carbamoyl phosphate (CP) and its conversion into citrulline via ornithine transcarbamylase (OTC). a–c represent the levels of plasma ammonia, total blood urea, and synthesis of 15N-labeled urea (sum of urea containing one and two 15N atoms) from 15NH4Cl injected in rats after 4 weeks of SD, SD + AGM, HFD, or HFD + AGM (details are under “Materials and Methods”). d and e represent the total levels of NAG and glutamate in the liver of the same rats. f represents the generation of 15N-labeled glutamate in experiments with isolated hepatocytes incubated with 15NH4Cl. g and h represent the generation of 13C-labeled NAG at two carbons (M2) and the total level of NAG following incubation of isolated hepatocytes with [U-13C]palmitate. i represents the generation of 15N-labeled urea in experiments with isolated hepatocytes incubated with 15NH4Cl. All incubations were carried out for 60 min as described under “Materials and Methods.” In a–e, error bars represent means ± S.D. of five to six rats in each experimental group. In f–i, error bars represent means ± S.D. of three to four independent experiments with hepatocytes obtained from three to four rats in each group. P1, significantly different from SD; P2, significantly different from HFD.
The synthesis of NAG is regulated by the availability of its precursors, acetyl-CoA and glutamate (3, 26). The current findings suggest that the stimulation of FAO and thus the generation of acetyl-CoA (Fig. 7) together with elevated hepatic glutamate (Fig. 11e) resulted in increased NAG synthesis and subsequent stimulation of ureagenesis. To further scrutinize this possibility, we used isolated hepatocytes obtained from rats that received AGM for 4 weeks. The results demonstrate a significantly higher generation of [15N]glutamate from 15NH4Cl (Fig. 11f), higher synthesis of 13C-labeled NAG from [U-13C]palmitate (Fig. 11g), and thereby elevation of [NAG] (Fig. 11h). The augmented generation of NAG was coupled with higher generation of [15N]urea (Fig. 11i) from 15NH4Cl in hepatocytes obtained from the SD + AGM group compared with the SD group. [15N]Glutamate probably formed following up-regulation of reductive amination of α-ketoglutarate by glutamate dehydrogenase. Increased availability of mitochondrial glutamate together with increased generation of acetyl-CoA from FAO resulted in increased synthesis of NAG and up-regulation of ureagenesis. The current finding is consistent with the concept that the synthesis of urea is determined in large measure by NAG synthesis (3, 26).
Potential Mechanism(s) by Which AGM Influences Metabolic Pathways
A key question yet to be addressed is how AGM influences genes responsible for Car biosynthesis and the resulting widespread impact on metabolic pathways such as enhancement of Car synthesis and stimulation of FAO and gluconeogenesis (Figs. 6–10). Here, we explored the hypothesis that the AGM-induced effect on whole body metabolic profiling may be mediated by an elevation of intracellular cAMP. To this end, we determined the expression of ADCY genes and synthesis of cAMP. There are at least nine closely related isoforms of ADCY that have been cloned and characterized in mammals (47). We measured the expression of ADCY5 and ADCY6 genes as representatives of ADCY isoforms. ADCY5 is located mainly in the liver, kidney, adipose tissue, and lung, whereas ADCY6 is widespread (47). Data in Fig. 12 demonstrate that AGM significantly increased the expression of ADCY5 in the liver (Fig. 12a) and eWAT (Fig. 12h) and increased ADCY6, mainly in eWAT (Fig. 12i). To determine whether the up-regulation of ADCY expression is translated into enzyme activity, we measured ex vivo the activity of ADCY in the liver. Fig. 12c demonstrates about 2- and 5-fold increased activity of ADCY in the liver homogenate obtained from SD + AGM and HFD + AGM compared with SD and HFD study groups, respectively. The elevated activity of ADCY was coupled with a significantly higher [cAMP] in the liver (Fig. 12d) and eWAT (Fig. 12j) of SD + AGM and HFD + AGM compared with either the SD or HFD study group. These findings suggest that AGM may increase intracellular cAMP by elevating ADCY expression and increasing the synthesis of cAMP.
FIGURE 12.

Agmatine up-regulates adenylyl cyclase expression, synthesis and levels of cAMP, and the resulting expression of downstream target genes. Measurements were performed in rat tissues after 4 weeks on SD, SD + AGM, HFD, or HFD + AGM. In the liver, AGM increased the expression of ADCY5 with no or little effect on ADCY6 (a and b), resulting in increased activity of ADCY (c) as measured in plasma membranes prepared from liver homogenates (a portion of the same livers used for mRNA analysis) and thereby significantly increased [cAMP] both in SD + AGM and HFD + AGM study groups (d). The elevated cellular [cAMP] is coupled with increased expression of CREB, PPARα, and PGC1α as indicated in e, f, and g, respectively. In the eWAT, AGM increased expression of ADCY5 and ADCY6 (h and i), augmented the cAMP level (j), and thereby significantly increased expression of CREB and PPARγ (k and l) with only a modest increase in PPARα expression (m). Gene expression was determined by RT-PCR using GAPDH as an internal control. Levels of mRNA (arbitrary units (A.U)) were calculated relative to SD. Error bars represent means ± S.D. of four to six rats in each group. P1, significantly different from control (SD); P2, significantly different from HFD.
It is well established that a rise in cellular cAMP and thereby cAMP signaling influences expression of genes engaged in fat and carbohydrate metabolism (4, 7, 8). For example, previous investigations suggest an intimate interplay between cAMP-PKA signaling and activation of PPARα (11, 12) and subsequently activation of downstream targets such as genes responsible for Car biosynthesis and transporters (11, 12). Similarly, PGC1α and the cAMP-responsive transcription factor CREB have a significant impact on hepatic carbohydrate metabolism (4, 48). To examine this possibility, we assessed the mRNA expression of PPARα, PGC1α, PPARγ, and CREB. In the liver of the HFD study group, AGM increased the expression of CREB, PPARα, and PGC1α (Fig. 12, e, f, and g). In the SD + AGM study group, CREB and PPARα were significantly increased (Fig. 12, e and f), and PGC1α was marginally significant (Fig. 12g). In the eWAT, AGM significantly increased CREB and PPARγ in both the SD + AGM and HFD + AGM groups with little effect on PPARα (Fig. 12, k, l, and m). PPARγ is abundant in adipose tissue where it is the key transcription factor determining adipose tissue growth and adiponectin secretion (4, 50). In addition, PPARγ plays an important role in curtailing insulin resistance in obesity, triggers mitochondrial biogenesis in white adipose tissue, and is necessary to induce the expression of mitochondrial genes involved in the brown fat-mediated thermogenic program (35, 50, 51). Hence, the current data are in close agreement with well established observations indicating that cAMP signaling activates CREB and PPARα and its coactivator, PGC1α (4, 8–12, 48). An AGM-induced increase in cAMP and cAMP signaling likely is responsible for the effects of AGM on Car biosynthesis and transport and the augmentation of FAO and gluconeogenesis.
DISCUSSION
Contribution of the Present Investigation to Understanding the Mechanism by Which Agmatine Acts and Its Impact on Whole Body Metabolomic Profiling
Numerous studies suggest that AGM may affect multiple metabolic and physiologic functions (2). However, the mechanism(s) of action, impact on whole body gene expression, impact on metabolomic profiling, and potential benefits and risks of long term AGM consumption in normal and disease states have been a mystery. The goals of the current investigation were to address these issues and to define in better detail the mechanism(s) of AGM action.
AGM can be generated in mammalian tissue via mitochondrial arginine decarboxylase (2). However, the high Km (25 mm) (52) of this reaction indicates that AGM must be supplemented to confer therapeutic impact. It has been shown that the effective systemic dose of AGM for which positive outcomes have been noted is about 100 mg/kg (2). Because in human plasma [AGM] ranges between 0.1 and 2 nmol/ml (2), AGM may be effective only at pharmacological doses. Here, we added 0.1% AGM to the drinking water, which resulted in consumption of about 55–75 mg/kg/day between days 20 and 55 of the study protocol (Fig. 1a). This regimen triggered a widespread impact on whole body metabolomic profiling and gene expression in both SD and HFD-induced obesity. Some of these metabolic changes are similar to those noted with caloric restriction (53). Thus, the current findings suggest that AGM may mimic some aspects of caloric restriction including (a) increased release of glucagon, (b) stimulation of cAMP production, (c) increased FAO, (d) reduced fat mass coupled with a decreased level of leptin and body weight gain, (e) increased adiponectin, and (f) enhanced ureagenesis and gluconeogenesis coupled with decreased glycolysis. In addition, elevation of UCP3 expression (Fig. 5) was previously reported during caloric restriction (54).
These caloric restriction-like actions of AGM are similar to those of resveratrol. However, in contrast to resveratrol, which may decrease cellular ATP and thereby activate AMP-activated protein kinase (55), the current data indicate that AGM had little effect on tissue AMP/ATP or ATP/ADP ratios (Table 3). Furthermore, a pilot study using cultured primary hepatocytes indicates little effect on the generation of phosphorylated AMP-activated protein kinase (data not shown). In addition, although the action of resveratrol seems to be mediated via inhibition of phosphodiesterases (55), we found that AGM primarily elevated synthesis of cAMP (Fig. 12). AGM may influence phosphodiesterase activity but only at high (mm) concentration as suggested in our in vitro study using a liver perfusion system (3). Nonetheless, as in the case of resveratrol, the current findings suggest that the impact of AGM may be mediated by elevating intracellular [cAMP] (Fig. 12), thereby influencing numerous genes and metabolic pathways. cAMP activates Epac, a cAMP-regulated ion channel, and/or the broad substrate specificity enzyme PKA (10–14). The cAMP-PKA pathway is one of the most common and versatile signal pathways in eukaryotic cells, and a large number of proteins have been identified as substrates for PKA (8, 9). For example, there is an intimate interplay between cAMP-PKA signaling and activation of PPARα (11, 12).
TABLE 3.
Levels of adenine nucleotides in the liver and muscle
Measurement was performed following 4 weeks of oral agmatine consumption as detailed under “Materials and Methods.” Levels are mean ± S.D. (n = 4–6 rats in each experimental group).
| SD | SD + AGM | HFD | HFD + AGM | |
|---|---|---|---|---|
| nmol/g wet weight | nmol/g wet weight | nmol/g wet weight | nmol/g wet weight | |
| Liver | ||||
| ATP | 2.4 ± 0.8 | 2.5 ± 0.7 | 2.5 ± 0.4 | 2.6 ± 0.6 |
| ADP | 1.5 ± 1.1 | 1.7 ± 0.4 | 1.4 ± 0.4 | 2.4 ± 0.9 |
| AMP | 1.4 ± 0.3 | 1.4 ± 0.2 | 1.2 ± .3 | 1.4 ± 0.4 |
| Muscle | ||||
| ATP | 5.7 ± 1 | 4.8 ± 1.1 | 4.4 ± 1.2 | 5.4 ± 1.6 |
| ADP | 1.7 ± 0.9 | 1.4 ± 0.4 | 1.3 ± 0.3 | 1.4 ± 0.5 |
| AMP | 0.4 ± 0.1 | 0.3 ± 0.1 | 0.3 ± 0.1 | 0.4 ± 0.1 |
PPARα is considered a master transcriptional regulator of lipid metabolism and energy homeostasis (11–17). PPARα-dependent gene transcription may be initiated by a ligand including fatty acids and/or by phosphorylation mediated via cAMP-PKA signaling (11, 12). The higher expression of PPARα in the liver of the HFD group compared with the SD study group (Fig. 12) may result from increased free fatty acids and insulin resistance as demonstrated in wild-type and PPARα-null mice fed an HFD (40, 56). Nonetheless, PPARα and PPARγ expression significantly increased in rats that received AGM compared with control animals (Fig. 12), and this increase correlated with the elevation of the tissue cAMP level regardless of the diet (Fig. 12), suggesting that it is the AGM-induced rise of cAMP that activates PPARα and downstream genes via a cAMP-PKA signaling mechanism. This possibility is in accord with the concept that PGC1α is activated by increased cAMP and is a target for PKA phosphorylation (11, 12, 15). The up-regulation of PGC1α expression (Fig. 12) may play a pivotal role in activation of PPARα and the transcriptional control of PPARα target genes such as those responsible for Car biosynthesis and transport (Figs. 8 and 9). Thus, the elevated cAMP level and up-regulation of PGC1α by AGM (Fig. 12) may integrate various metabolic pathways in the liver and regulate transcription of genes involved in hepatic gluconeogenesis, fatty acid catabolism, and oxidative phosphorylation as demonstrated by the data presented in Figs. 6–10. Furthermore, the notion that cAMP-PKA signaling may be the primary mechanism by which AGM influences the hepatic metabolic pathways is supported by the phenomenon that genes essential for liver gluconeogenesis are under the control of the cAMP-PKA signaling pathway (4, 43, 48). An increase of cAMP will lead to phosphorylation of CREB via PKA and thereby upregulate the expression of gluconeogenic enzymes such as phosphoenolpyruvate carboxykinase and glucose-6-phosphatase (4, 44, 48). The overall result would be a stimulation of gluconeogenesis as indicated in the data presented (see Fig. 10). Therefore, as illustrated in Fig. 13, the current findings suggest that the molecular and metabolic impact of AGM may be mediated via cAMP-PKA signaling subsequent to AGM-induced elevation of intracellular cAMP.
FIGURE 13.

A schematic representation of the impact of agmatine on the molecular and metabolic pathways. The current findings indicate that AGM elevates the synthesis and levels of cAMP (Fig. 12) and subsequently may activate the cAMP-PKA pathway. The latter initiates a molecular and metabolic chain reaction including phosphorylation and activation of CREB, PGC1α, and PPARα. The up-regulation of PPARα resulted in activation of downstream target genes responsible for Car synthesis and transport (Figs. 8 and 9) and hence augmented the synthesis of Car and its level in plasma (Fig. 6) and tissues (Table 2). The increased synthesis of Car together with increased expression of CREB and PGC1α led to increased β-oxidation (Fig. 7) and increased fluxes through pyruvate dehydrogenase (PDH), pyruvate carboxylase (PC), the TCA cycle, and gluconeogenesis but decreased glycolysis (Fig. 10). Simultaneously, the up-regulation of UCPs (Fig. 5) is expected to elevate the metabolic rate. The latter, when coupled with elevated expression of PPARγ in adipose tissue (Fig. 12), resulted in higher fat oxidation as well as decreased fat mass (Figs. 3 and 4), decreased body weight gain (Fig. 1), and thereby improved insulin sensitivity (Fig. 2). In addition, the products of β-oxidation, such as acetyl-CoA together with the augmented cataplerosis and generation of glutamate through the TCA cycle, resulted in augmented synthesis of NAG, stimulation of ureagenesis, and removal of waste nitrogen from the body (Fig. 11). These coordinated changes in gene expression and metabolic pathways and thereby the AGM-induced metabolic reprogramming suggest that AGM may lessen the so-called metabolic syndrome, i.e. the metabolic malfunctions associated with HFD-induced obesity. ↑ indicates stimulation or improvement, and ↓ indicates decrease.
An important question is how AGM elevates intracellular cAMP. There are several non-exclusive possibilities. (a) AGM (or its metabolite) acts at the transcriptional level to up-regulate ADCY gene expression and thereby elevate ADCY activity and synthesis of cAMP (Fig. 12). (b) Intracellular [cAMP] may depend upon augmented synthesis of cAMP and/or inhibition of phosphodiesterases, a group of enzymes that hydrolyze cAMP (57). Our previous in vitro study with a liver perfusion system suggests that AGM may elevate intracellular [cAMP] by curtailing cAMP hydrolysis. However, any effect on cAMP hydrolysis via the phosphodiesterases occurs at a very high (mm) concentration of AGM (3), a level far greater than the nanomolar concentration found in the liver of rats given AGM (Fig. 1). (c) The current data indicate that AGM supplementation for 4 weeks increased the plasma glucagon level and the glucagon/insulin molar ratio (Fig. 2, b and c). It is well established that an elevation of plasma glucagon increases the synthesis and concentration of cAMP (43, 58). Therefore, concurrent to the up-regulation of ADCY genes, AGM may stimulate the synthesis of cAMP secondary to elevating the plasma glucagon/insulin ratio (Fig. 2). In this regard, it is important to note that the signal(s) and/or factor(s) responsible for glucagon secretion by pancreatic α-cells is uncertain (59). Several pathways have been suggested to regulate glucagon secretion including a direct effect of hormones and factors such as zinc and γ-aminobutyric acid that are released by adjacent endocrine cells within the islets (59). Our previous report has demonstrated that glycine in human islets can function as a neurotransmitter, stimulating glucagon secretion by α-cells (31). In addition, arginine significantly increases glucagon secretion by α-cells (60), and AGM may stimulate glucagon secretion similarly to arginine. The increased plasma glucagon level following AGM consumption (Fig. 2b) may be mediated by a paracrine signaling mechanism similar to that of glycine (31) and/or arginine (60). Future investigations with isolated islets are required to scrutinize this possibility.
Implications of the Present Findings for the Potential Use of AGM as Dietary Supplement: Promises and Pitfalls
The present study suggests a potential role for AGM as a therapeutic agent. This conclusion is supported by the widespread effects that AGM had on metabolism and gene expression. What follows is a summary discussion of the translational relevance of the current findings.
Previous findings indicated that obesity is associated with an elevated ratio of medium to long chain AcylCar as well as decreased Car availability, incomplete fatty acid oxidation, and thereby insulin resistance and type 2 diabetes (15, 20, 21, 38). Although dietary supplementation of Car may attenuate these metabolic disorders (40), the effectiveness of Car intervention may be limited due to malfunction of Car transporters in obesity and HFD (16, 40, 56). Therefore, the demonstration that AGM up-regulates genes responsible for Car biosynthesis and transport (Figs. 8 and 9) together with improving systemic Car status in HFD (Fig. 6 and Table 2) suggests that AGM may have an important role in enhancing mitochondrial function, maintaining metabolic flexibility, improving tissue insulin sensitivity, and thereby curtailing type 2 diabetes and metabolic syndrome. These findings point toward a potential use of AGM to minimize metabolic derangements that are associated with HFD, fatty liver, or obesity.
The major mechanism driving hepatic triglyceride accumulation and fatty liver disease is increased delivery of free fatty acids from peripheral adipose depots to the liver (5, 61). Hepatic lipid removal via both mitochondrial and peroxisomal β-oxidation is a central process for preventing fatty liver disease. The current findings that AGM improved Car status (Fig. 6 and Table 2) and decreased triglyceride accumulation in the liver and muscles (Figs. 3 and 4) suggest that AGM may be a useful agent for preventing fatty liver disease and the associated metabolic syndrome.
Up-regulation of UCP genes by AGM (Fig. 5) may promote energy expenditure and body weight loss (34, 35, 37, 49). This process is important in combating obesity and the insulin resistance and type 2 diabetes associated with metabolic syndrome. This possibility is demonstrated by decreased body weight gain (Fig. 1), increased hepatic FAO (Fig. 7), and gluconeogenesis (Fig. 10) coupled with up-regulation of UCP2 and UCP3 genes (Fig. 5). UCP2 and UCP3 are homologs of UCP1 and have been proposed to be involved in the regulation of the formation of reactive oxygen species, the use of lipids as fuel, and protection of mitochondria against lipotoxicity (37, 49).
The present findings indicate that AGM enhances hepatic ureagenesis and thus ammonia detoxification in vivo. The data demonstrate that a HFD elevated blood ammonia and diminished ureagenesis (Fig. 11). A chronic hyperammonemia associated with obesity may cause a toxic perturbation and dysfunction of the central nervous system. AGM may improve the detoxification of systemic excess ammonia via enhanced synthesis of NAG and a consequent enhancement of urea synthesis (Fig. 11), thereby relieving deleterious central nervous system effects of hyperammonemia in HFD-induced obesity.
Alongside the potential benefits discussed above, a few pitfalls also may be associated with long term consumption of AGM. For example, systemic glucose homeostasis depends critically on the balance among hepatic glycolysis, glycogenolysis, and gluconeogenesis. The latter may be one of the reasons for hyperglycemia in type 2 diabetes, and the AGM-induced stimulation of gluconeogenesis (Fig. 10) as well as the increased glucagon/insulin ratio (Fig. 2) may worsen hyperglycemia. Nonetheless, the current observations indicate little or no change in the plasma glucose level following 4 or 8 weeks of AGM consumption (Fig. 2). However, additional long term study in normal and diabetic animals is required to scrutinize this potential pitfall. Another possible risk may relate to chronic overexpression of UCP2 and/or UCP3 by AGM, a process that may contribute to development of colon and breast cancer (37, 49). Increased gene expression of UCP3 has been reported in several cachectic diseases, cancer, sepsis, burn injury, and rheumatoid arthritis (49). Moreover, a chronic and long term overexpression of ADCY genes by AGM may result in myocardial damage as seen in an animal model (49). Therefore, more work is necessary to examine the potential risks and benefits of long term AGM consumption in healthy and disease states.
Conclusion and Long Term Perspective
AGM, which triggered widespread changes in gene expression and whole body metabolomic profiling, may be a useful agent to improve body Car/AcylCar profiling and fat oxidation. As such, AGM may curtail metabolic syndrome and hormonal derangements associated with obesity and fatty liver. Likewise, the current findings suggest potential risks associated with long term AGM consumption such as worsening hyperglycemia due to augmented gluconeogenesis. Collectively, these findings add new information on the biological effects of AGM. This information may be useful to further elucidate its mechanism of action and to evaluate its therapeutic potential as an antiobesity drug. Both the safety/tolerability and the potential risks of AGM should be further investigated through a larger study of longer duration in animal models of metabolic syndrome and obesity.
Acknowledgments
We gratefully acknowledge the support provided by the Metabolomic Core of the Children's Hospital of Philadelphia Research Institute and Heather Collins, Ph.D., for measurement of plasma hormones in the Radioimmunoassay and Biomarkers Core, Penn Diabetes Research Center (supported by NIH Grant PO30-DK19525).
This work was supported, in whole or in part, by National Institutes of Health Grants DK-053761 (to I. N.) and PO1HD26979 (to M. Y.).
- AGM
- agmatine
- ADCY
- adenylyl cyclase
- AcylCar
- acylcarnitine
- Car
- carnitine
- NAG
- N-acetylglutamate
- FAO
- fatty acid oxidation
- PPAR
- peroxisomal proliferator-activated receptor
- HFD
- high fat diet
- SD
- standard chow diet
- TCA
- tricarboxylic acid cycle
- γ-BBD
- γ-butyrobetaine dioxygenase
- TG
- triglycerides
- BW
- body weight
- UCP
- uncoupling protein
- eWAT
- epididymal white adipose tissue
- KB
- ketone bodies
- TML
- trimethyllysine
- CREB
- cAMP-responsive element-binding protein.
REFERENCES
- 1. Li G., Regunathan S., Barrow C. J., Eshraghi J., Cooper R., Reis D. J. (1994) Agmatine: an endogenous clonidine-displacing substance in the brain. Science 263, 966–969 [DOI] [PubMed] [Google Scholar]
- 2. Piletz J. E., Aricioglu F., Cheng J. T., Fairbanks C. A., Gilad V. H., Haenisch B., Halaris A., Hong S., Lee J. E., Li J., Liu P., Molderings G. J., Rodrigues A. L., Satriano J., Seong G. J., Wilcox G., Wu N., Gilad G. M. (2013) Agmatine: clinical applications after 100 years in translation. Drug Discov. Today 18, 880–893 [DOI] [PubMed] [Google Scholar]
- 3. Nissim I., Daikhin Y., Nissim I., Luhovyy B., Horyn O., Wehrli S. L., Yudkoff M. (2006) Agmatine stimulates hepatic fatty acid oxidation: a possible mechanism for up-regulation of ureagenesis. J. Biol. Chem. 281, 8486–8496 [DOI] [PubMed] [Google Scholar]
- 4. Jitrapakdee S. (2012) Transcription factors and coactivators controlling nutrient and hormonal regulation of hepatic gluconeogenesis. Int. J. Biochem. Cell Biol. 44, 33–45 [DOI] [PubMed] [Google Scholar]
- 5. Leavens K. F., Easton R. M., Shulman G. I., Previs S. F., Birnbaum M. J. (2009) Akt2 is required for hepatic lipid accumulation in models of insulin resistance. Cell Metab. 10, 405–418 [DOI] [PMC free article] [PubMed] [Google Scholar]
- 6. Nissim I., Horyn O., Daikhin Y., Nissim I., Luhovyy B., Phillips P. C., Yudkoff M. (2006) Ifosfamide-induced nephrotoxicity: mechanism and prevention. Cancer Res. 66, 7824–7831 [DOI] [PubMed] [Google Scholar]
- 7. Fimia G. M., Sassone-Corsi P. (2001) Cyclic AMP signalling. J. Cell Sci. 114, 1971–1972 [DOI] [PubMed] [Google Scholar]
- 8. Cheng X., Ji Z., Tsalkova T., Mei F. (2008) Epac and PKA: a tale of two intracellular cAMP receptors. Acta Biochim. Biophys. Sin. 40, 651–662 [DOI] [PMC free article] [PubMed] [Google Scholar]
- 9. Taskén K., Aandahl E. M. (2004) Localized effects of cAMP mediated by distinct routes of protein kinase A. Physiol. Rev. 84, 137–167 [DOI] [PubMed] [Google Scholar]
- 10. Sands W. A., Palmer T. M. (2008) Regulating gene transcription in response to cyclic AMP elevation. Cell. Signal. 20, 460–466 [DOI] [PubMed] [Google Scholar]
- 11. Lazennec G., Canaple L., Saugy D., Wahli W. (2000) Activation of peroxisome proliferator-activated receptors (PPARs) by their ligands and protein kinase A activators. Mol. Endocrinol. 14, 1962–1975 [DOI] [PMC free article] [PubMed] [Google Scholar]
- 12. Burns K. A., Vanden Heuvel J. P. (2007) Modulation of PPAR activity via phosphorylation. Biochim Biophys Acta 1771, 952–960 [DOI] [PMC free article] [PubMed] [Google Scholar]
- 13. Burkart E. M., Sambandam N., Han X., Gross R. W., Courtois M., Gierasch C. M., Shoghi K., Welch M. J., Kelly D. P. (2007) Nuclear receptors PPARβ/δ and PPARα direct distinct metabolic regulatory programs in the mouse heart. J. Clin. Investig. 117, 3930–3939 [DOI] [PMC free article] [PubMed] [Google Scholar]
- 14. Kelly D. P. (2001) The pleiotropic nature of the vascular PPAR gene regulatory pathway. Circ. Res. 89, 935–937 [PubMed] [Google Scholar]
- 15. Muoio D. M., Koves T. R. (2007) Skeletal muscle adaptation to fatty acid depends on coordinated actions of the PPARs and PGC1α: implications for metabolic disease. Appl. Physiol. Nutr. Metab. 32, 874–883 [DOI] [PubMed] [Google Scholar]
- 16. Gutgesell A., Wen G., König B., Koch A., Spielmann J., Stangl G. I., Eder K., Ringseis R. (2009) Mouse carnitine-acylcarnitine translocase (CACT) is transcriptionally regulated by PPARα and PPARδ in liver cells. Biochim. Biophys. Acta 1790, 1206–1216 [DOI] [PubMed] [Google Scholar]
- 17. Mandard S., Müller M., Kersten S. (2004) Peroxisome proliferator-activated receptor α target genes. Cell. Mol. Life Sci. 61, 393–416 [DOI] [PMC free article] [PubMed] [Google Scholar]
- 18. van Vlies N., Ferdinandusse S., Turkenburg M., Wanders R. J., Vaz F. M. (2007) PPARα-activation results in enhanced carnitine biosynthesis and OCTN2-mediated hepatic carnitine accumulation. Biochim. Biophys. Acta 1767, 1134–1142 [DOI] [PubMed] [Google Scholar]
- 19. Eder K., Ringseis R. (2010) The role of peroxisome proliferator-activated receptor α in transcriptional regulation of novel organic cation transporters. Eur. J. Pharmacol. 628, 1–5 [DOI] [PubMed] [Google Scholar]
- 20. Noland R. C., Koves T. R., Seiler S. E., Lum H., Lust R. M., Ilkayeva O., Stevens R. D., Hegardt F. G., Muoio D. M. (2009) Carnitine insufficiency caused by aging and overnutrition compromises mitochondrial performance and metabolic control. J. Biol. Chem. 284, 22840–22852 [DOI] [PMC free article] [PubMed] [Google Scholar]
- 21. Muoio D. M., Noland R. C., Kovalik J. P., Seiler S. E., Davies M. N., DeBalsi K. L., Ilkayeva O. R., Stevens R. D., Kheterpal I., Zhang J., Covington J. D., Bajpeyi S., Ravussin E., Kraus W., Koves T. R., Mynatt R. L. (2012) Muscle-specific deletion of carnitine acetyltransferase compromises glucose tolerance and metabolic flexibility. Cell Metab. 15, 764–777 [DOI] [PMC free article] [PubMed] [Google Scholar]
- 22. Nissim I., Horyn O., Nissim I., Daikhin Y., Wehrli S. L., Yudkoff M., Matschinsky F. M. (2012) Effects of a glucokinase activator on hepatic intermediary metabolism: study with 13C isotopomer-based metabolomics. Biochem. J. 444, 537–551 [DOI] [PMC free article] [PubMed] [Google Scholar]
- 23. van Vlies N., Wanders R. J., Vaz F. M. (2006) Measurement of carnitine biosynthesis enzyme activities by tandem mass spectrometry: differences between the mouse and the rat. Anal. Biochem. 354, 132–139 [DOI] [PubMed] [Google Scholar]
- 24. Strijbis K., Vaz F. M., Distel B. (2010) Enzymology of the carnitine biosynthesis pathway. IUBMB Life 62, 357–362 [DOI] [PubMed] [Google Scholar]
- 25. ter Veld F., Mueller M., Kramer S., Haussmann U., Herebian D., Mayatepek E., Laryea M. D., Primassin S., Spiekerkoetter U. (2009) A novel tandem mass spectrometry method for rapid confirmation of medium- and very long-chain acyl-CoA dehydrogenase deficiency in newborns. PLoS One 4, e6449. [DOI] [PMC free article] [PubMed] [Google Scholar]
- 26. Nissim I., Horyn O., Nissim I., Daikhin Y., Caldovic L., Barcelona B., Cervera J., Tuchman M., Yudkoff M. (2011) Down-regulation of hepatic urea synthesis by oxypurines: xanthine and uric acid inhibit N-acetylglutamate synthase. J. Biol. Chem. 286, 22055–22068 [DOI] [PMC free article] [PubMed] [Google Scholar]
- 27. Nissim I., Brosnan M. E., Yudkoff M., Brosnan J. T. (1999) Insulin and glucagon regulation of hepatic glutamine kinetics and metabolism: studies in perfused liver with 15N. J. Biol. Chem. 274, 28958–28965 [DOI] [PubMed] [Google Scholar]
- 28. Nissim I., Weinberg J. M. (1996) Glycine attenuates maleate or ifosfamide induced Fanconi syndrome in rats. Kidney Int. 49, 684–695 [DOI] [PubMed] [Google Scholar]
- 29. Nomura M., Beltrán C., Darszon A., Vacquier V. D. (2005) A soluble adenylyl cyclase from sea urchin spermatozoa. Gene 353, 231–238 [DOI] [PubMed] [Google Scholar]
- 30. Folch J., Lees M., Sloane Stanley G. H. (1957) A simple method for the isolation and purification of total lipids from animal tissues. J. Biol. Chem. 226, 497–509 [PubMed] [Google Scholar]
- 31. Li C., Liu C., Nissim I., Chen J., Chen P., Doliba N., Zhang T., Nissim I., Daikhin Y., Stokes D., Yudkoff M., Bennett M. J., Stanley C. A., Matschinsky F. M., Naji A. (2013) Regulation of glucagon secretion in normal and diabetic human islets by β-hydroxybutyrate and glycine. J. Biol. Chem. 288, 3938–3951 [DOI] [PMC free article] [PubMed] [Google Scholar]
- 32. Livak K. J., Schmittgen T. D. (2001) Analysis of relative gene expression data using real-time quantitative PCR and the 2−ΔΔ2CT method. Methods 25, 402–408 [DOI] [PubMed] [Google Scholar]
- 33. Yang L., Kasumov T., Kombu R. S., Zhu S.-H., Cendrowski A. V., David F., Anderson V. E., Kelleher J. K., Brunengraber H. (2008) Metabolomic and mass isotopomer analysis of liver gluconeogenesis and citric acid cycle: II. Heterogeneity of metabolite labeling pattern. J. Biol. Chem. 283, 21988–21996 [DOI] [PMC free article] [PubMed] [Google Scholar]
- 34. Bastard J. P., Maachi M., Lagathu C., Kim M. J., Caron M., Vidal H., Capeau J., Feve B. (2006) Recent advances in the relationship between obesity, inflammation, and insulin resistance. Eur. Cytokine Netw. 17, 4–12 [PubMed] [Google Scholar]
- 35. Wolf G. (2009) Brown adipose tissue: the molecular mechanism of its formation. Nutr. Rev. 67, 167–171 [DOI] [PubMed] [Google Scholar]
- 36. Yonezawa T., Kurata R., Hosomichi K., Kono A., Kimura M., Inoko H. (2009) Nutritional and hormonal regulation of uncoupling protein 2. IUBMB Life 61, 1123–1131 [DOI] [PubMed] [Google Scholar]
- 37. Robbins D., Zhao Y. (2011) New aspects of mitochondrial uncoupling proteins (UCPs) and their roles in tumorigenesis. Int. J. Mol. Sci. 12, 5285–5293 [DOI] [PMC free article] [PubMed] [Google Scholar]
- 38. Muoio D. M., Neufer P. D. (2012) (2012) Lipid-induced mitochondrial stress and insulin action in muscle. Cell Metab. 15, 595–605 [DOI] [PMC free article] [PubMed] [Google Scholar]
- 39. Sampey B. P., Freemerman A. J., Zhang J., Kuan P. F., Galanko J. A., O'Connell T. M., Ilkayeva O. R., Muehlbauer M. J., Stevens R. D., Newgard C. B., Brauer H. A., Troester M. A., Makowski L. (2012) Metabolomic profiling reveals mitochondrial-derived lipid biomarkers that drive obesity-associated inflammation. PLoS One 7, e38812. [DOI] [PMC free article] [PubMed] [Google Scholar]
- 40. Makowski L., Noland R. C., Koves T. R., Xing W., Ilkayeva O. R., Muehlbauer M. J., Stevens R. D., Muoio D. M. (2009) Metabolic profiling of PPARα−/− mice reveals defects in carnitine and amino acid homeostasis that are partially reversed by oral carnitine supplementation. FASEB J. 23, 586–604 [DOI] [PMC free article] [PubMed] [Google Scholar]
- 41. Ringseis R., Pösel S., Hirche F., Eder K. (2007) Treatment with pharmacological peroxisome proliferator activated receptor α agonist clofibrate causes upregulation of organic cation transporter 2 in liver and small intestine of rats. Pharmacol. Res. 56, 175–183 [DOI] [PubMed] [Google Scholar]
- 42. Lamhonwah A. M., Tein I. (2006) Novel localization of OCTN1, an organic cation/carnitine transporter, to mammalian mitochondria. Biochem. Biophys. Res. Commun. 345, 1315–1325 [DOI] [PubMed] [Google Scholar]
- 43. Exton J. H. (1987) Mechanisms of hormonal regulation of hepatic glucose metabolism. Diabetes Metab. Rev. 3, 163–183 [DOI] [PubMed] [Google Scholar]
- 44. Burgess S. C., Leone T. C., Wende A. R., Croce M. A., Chen Z., Sherry A. D., Malloy C. R., Finck B. N. (2006) Diminished hepatic gluconeogenesis via defects in tricarboxylic acid cycle flux in peroxisome proliferator-activated receptor gamma coactivator-1α (PGC-1α)-deficient mice. J. Biol. Chem. 281, 19000–19008 [DOI] [PMC free article] [PubMed] [Google Scholar]
- 45. Berthon P., Van der Veer M., Denis C., Freyssenet D. (1997) L-Carnitine stimulation of mitochondrial oxidative phosphorylation rate in isolated rat skeletal muscle mitochondria. Comp. Biochem. Physiol. A Physiol. 117, 141–145 [DOI] [PubMed] [Google Scholar]
- 46. Herzig S., Long F., Jhala U. S., Hedrick S., Quinn R., Bauer A., Rudolph D., Schutz G., Yoon C., Puigserver P., Spiegelman B., Montminy M. (2001) CREB regulates hepatic gluconeogenesis through the coactivator PGC-1. Nature 413, 179–183 [DOI] [PubMed] [Google Scholar]
- 47. Defer N., Best-Belpomme M., Hanoune J. (2000) Tissue specificity and physiological relevance of various isoforms of adenylyl cyclase. Am. J. Physiol. Renal Physiol. 279, F400–F416 [DOI] [PubMed] [Google Scholar]
- 48. Servillo G., Della Fazia M. A., Sassone-Corsi P. (2002) Coupling cAMP signaling to transcription in the liver: pivotal role of CREB and CREM. Exp. Cell Res. 275, 143–154 [DOI] [PubMed] [Google Scholar]
- 49. Minnaard R., Schrauwen P., Schaart G., Hesselink M. K. (2006) UCP3 in muscle wasting, a role in modulating lipotoxicity? FEBS Lett. 580, 5172–5176 [DOI] [PubMed] [Google Scholar]
- 50. Anghel S.I., Wahli W. (2007) A kingdom for PPARγ. Cell Res. 17, 486–511 [DOI] [PubMed] [Google Scholar]
- 51. Nedergaard J., Petrovic N., Lindgren E. M., Jacobsson A., Cannon B. (2005) PPARγ in the control of brown adipocyte differentiation. Biochim. Biophys. Acta 1740, 293–304 [DOI] [PubMed] [Google Scholar]
- 52. Horyn O., Luhovyy B., Lazarow A., Daikhin Y., Nissim I., Yudkoff M., Nissim I. (2005) Biosynthesis of agmatine in isolated mitochondria and perfused rat liver: studies with 15N-labeled arginine. Biochem. J. 388, 419–425 [DOI] [PMC free article] [PubMed] [Google Scholar]
- 53. Anderson R. M., Weindruch R. (2010) Metabolic reprogramming, caloric restriction and aging. Trends Endocrinol. Metab. 21, 134–141 [DOI] [PMC free article] [PubMed] [Google Scholar]
- 54. Bevilacqua L., Ramsey J. J., Hagopian K., Weindruch R., Harper M. E. (2005) Long-term caloric restriction increases UCP3 content but decreases proton leak and reactive oxygen species production in rat skeletal muscle mitochondria. Am. J. Physiol. Endocrinol. Metab. 289, E429–E438 [DOI] [PubMed] [Google Scholar]
- 55. Park S. J., Ahmad F., Philp A., Baar K., Williams T., Luo H., Ke H., Rehmann H., Taussig R., Brown A. L., Kim M. K., Beaven M. A., Burgin A. B., Manganiello V., Chung J. H. (2012) Resveratrol ameliorates aging-related metabolic phenotypes by inhibiting cAMP phosphodiesterases. Cell 148, 421–433 [DOI] [PMC free article] [PubMed] [Google Scholar]
- 56. Ringseis R., Mooren F.-C., Keller J., Couturier A., Wen G., Hirche F., Stangl G. I., Eder K., Krüger K. (2011) Regular endurance exercise improves the diminished hepatic carnitine status in mice fed a high-fat diet. Mol. Nutr. Food Res. 55, S193–S202 [DOI] [PubMed] [Google Scholar]
- 57. Omori K., Kotera J. (2007) Overview of PDEs and their regulation. Circ. Res. 100, 309–327 [DOI] [PubMed] [Google Scholar]
- 58. Dighe R. R., Rojas F. J., Birnbaumer L., Garber A. J. (1984) Glucagon-stimulable adenylyl cyclase in rat liver. The impact of streptozotocin-induced diabetes mellitus. J. Clin. Investig. 73, 1013–1023 [DOI] [PMC free article] [PubMed] [Google Scholar]
- 59. Hardy A. B., Serino A. S., Wijesekara N., Chimienti F., Wheeler M. B. (2011) Regulation of glucagon secretion by zinc: lessons from the β-cells-specific Znt8 knockout model. Diabetes Obes. Metab. 13, (Suppl. 1) 112–117 [DOI] [PubMed] [Google Scholar]
- 60. Pipeleers D. G., Schuit F. C., Van Schravendijk C. F., Van de Winkel M. (1985) Interplay of nutrients and hormones in the regulation of glucagon release. Endocrinology 117, 817–823 [DOI] [PubMed] [Google Scholar]
- 61. Sun Z., Lazar M. A. (2013) Dissociating fatty liver and diabetes. Trends Endocrinol. Metab. 24, 4–12 [DOI] [PMC free article] [PubMed] [Google Scholar]