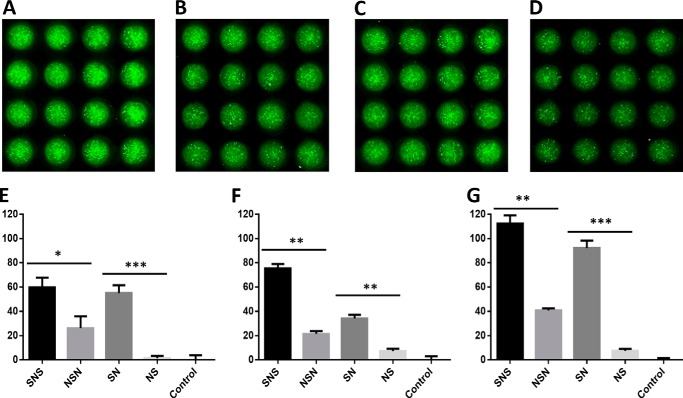
FIGURE 7.
High cell density microarray-based printing allows for probing the HS block copolymer-mediated FGF-FGFR signaling allowing the direct comparison of large numbers of replicates on a single slide. On the microarray chip, 48 replicates can be assayed using the same amount of material required for 1 replicate in a 96-well microtiter plate assay. This improvement allows for increased statistical significance in experimentation while also reducing the amount of overall material needed. Shown are 16-spot snapshots of SNS-induced growth (A), NSN-induced growth (B), SN-induced growth (C), and NS-induced growth (D) with FGF2 and FGFR3c expressing cells. Within each snapshot, these fluorescent intensity images allow for the qualitative assessment of each slide before a more thorough fluorescent intensity quantification using computational software. Block copolymers probed against FGF2 and FGFR1c (E), FGFR2c (F), or FGFR3c (G) indicate that non-reducing end sulfonation is highly important to completing the FGF-HS-FGFR ternary complex. In all cases there were statistical (* = p < 0.05; ** = p < 0.01; *** = p < 0.001) differences in cellular proliferation when comparing SNS and NSN or SN and NS. The relative proliferation percentage (plotted on the y axis) was normalized against a positive control of FGF-heparin-FGFR proliferation and a negative control of no GAG added, non-growth.

