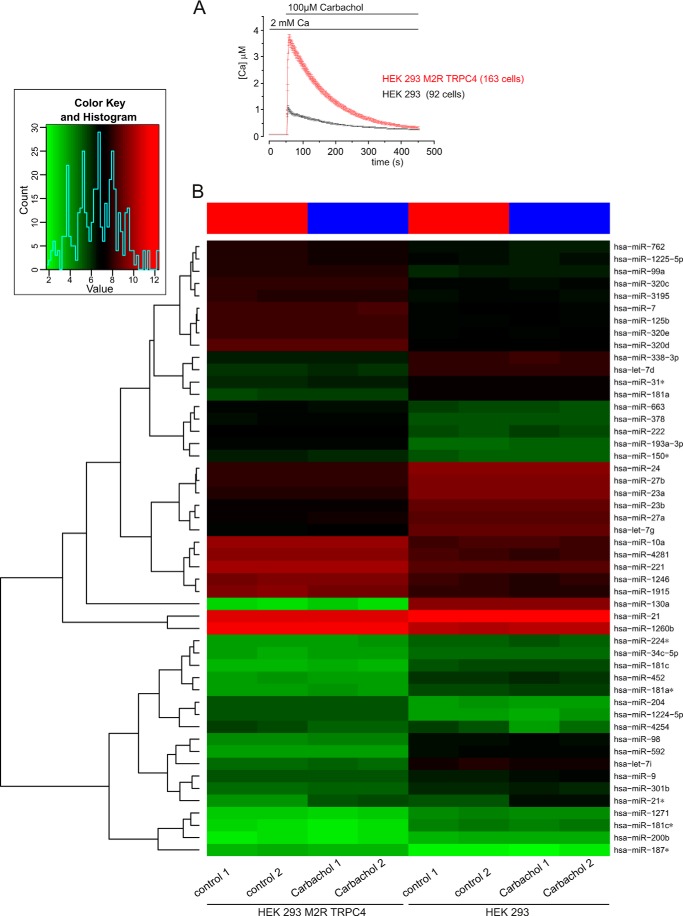
FIGURE 5.
miRNA expression in TRPC4-expressing cells. A, monitoring cytosolic [Ca2+] in the presence of carbachol. B, heat map of miRNAs derived from cells that were grown in the absence or presence of carbachol. HEK293/M2R/TRPC4 cells and HEK 293 cells were incubated in the presence of 100 μm carbachol for 15 min. Controls were performed without carbachol treatment for both HEK293/M2R/TRPC4 cells and HEK 293 cells. Each experiment was done in duplicate (carbachol 1/2 and control 1/2). miRNA expression was analyzed using SurePrint 8 × 60K human v16 miRNA microarrays (Agilent) that contained 40 replicates of 1205 miRNAs. A heat map was generated using the 50 miRNAs with highest expression variance over all samples. The miRNA expression values are visualized by the red-green color code, where green means low expression and red means high expression. The samples (with/without carbachol) are arranged in columns and the 50 selected miRNAs in rows. The heat map shows that HEK293/M2R/TRPC4 cells and HEK 293 cells cluster separately, indicating that each cell line has a specific miRNA expression pattern. For each cell line there is a clear differentiation between the carbachol treatments and controls, as indicated by the red (controls) and blue (carbachol) bars at the top of the heat map. The duplicates cluster closely together, indicating the high reproducibility of the data. The dendrogram on the left side of the heat map shows miRNAs clusters on the basis of the similarity of their expression levels. Inset, summary of the overall distribution of all miRNA counts according to their expression level, with the lowest expression level in green and the highest expression in red.

