
FIGURE 1.
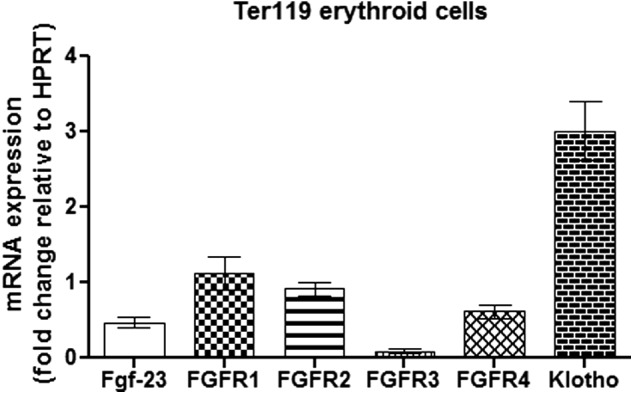
Erythroid cells express Fgf-23 signaling components. Quantitative real time RT-PCR show changes in Fgf-23, klotho, and FGFR1–4 mRNA expression in isolated Ter119+ erythroid cells from WT BM (n = 8–9). The data are represented as mean fold change ± S.E. relative to housekeeping gene HPRT.