
FIGURE 8.
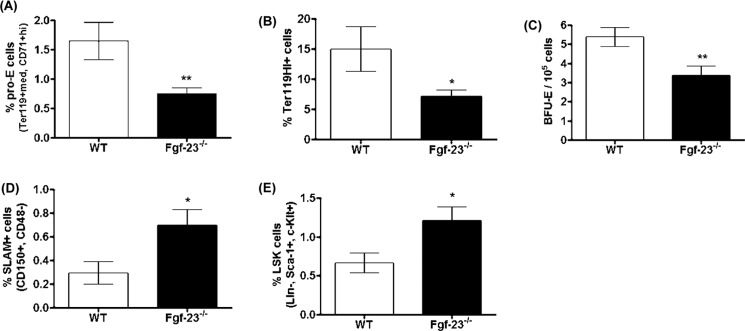
Flow cytometry analysis and colony-forming assays of spleens from 6 week old WT and Fgf-23−/− mice. A and B, flow cytometry. A, percentage of early erythroid cells (pro-E) stained positive for Ter119med and CD71high (WT, n = 6; Fgf-23−/−, n = 9). B, percentage of mature erythroid cells stained positive for Ter119 (WT, n = 6; Fgf-23−/−, n = 7). C, colony-forming assay for erythroid (BFU-E) progenitors (WT, n = 7; Fgf-23−/−, n = 8). Cells from each mouse were plated in duplicate, and the number of colonies in each plate was counted. D and E, flow cytometry. D, percentage of HSC population stained for SLAM (CD150+CD48−) (WT, n = 8; Fgf-23−/−, n = 5). E, percentage of HSC population stained for LSK (Sca-1 FITC (Ly6A-E), c-Kit Percp Cy5.5 (CD117), and APC-tagged lineage mixture comprising of antibodies against CD3, B220 (CD45R), Ly6G and Ly6C (Gr-1), CD11b (Mac-1), and TER119. c-Kit+Sca1+ cells were gated on lineage negative fraction to analyze LSK (Lin−c-Kit+Sca1+). The data are represented as means ± S.E. *, p < 0.05; **, p < 0.01.