
FIGURE 8.
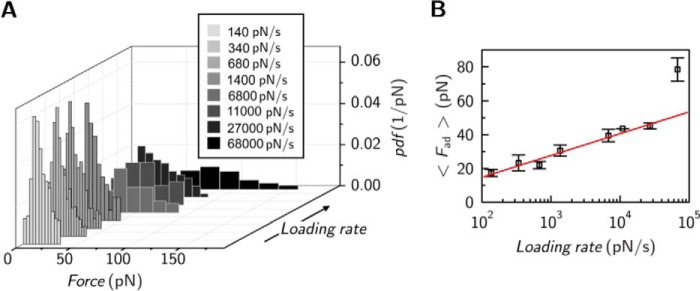
Interaction between ezrin T567D and F-actin as a function of applied loading rate in single molecule experiments. A, adhesion force histograms at different loading rates. B, loading rate dependence of mean adhesion force in single molecule experiments (n = 28 independent experiments).