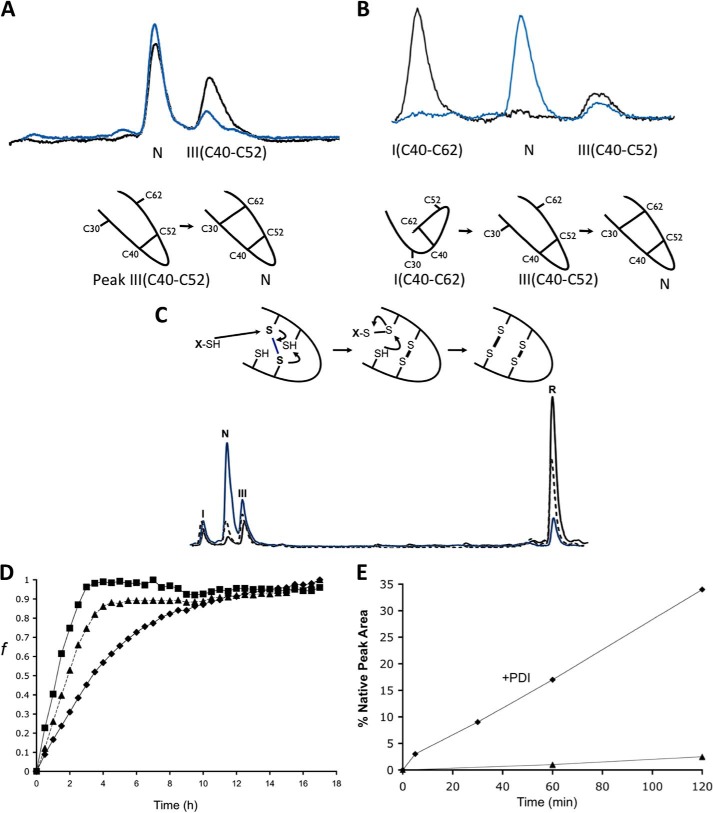
FIGURE 3.
Stop/Go folding of Cox19 intermediates. A, purified Peak III corresponding to Cys40-Cys52 was redissolved in Tris 50 mm NaCl, pH 8.4, and its evolution was followed by RP-HPLC. Sample corresponding to time 0 (black) and time 2 h (blue) are shown for comparison. B, purified Peak I, corresponding to Cys40-Cys62 was analyzed as above. Peak I converts to native protein probably after reshuffling to Cys40-Cys52. C, oxidative folding reactions in the presence of GSH (5 mm, blue) and GndHCl (300 mm, dashed) were quenched after 3 h and analyzed by RP-HPLC. Although displaying the same intermediates (peak I and III) both reactions were accelerated relative to the control (black). D, Cox19 folding can be monitored by fluorescence using ANS as a probe for the formation of a hydrophobic core. Reactions were performed in the presence of GSH (5 mm, ■) and GndHCl (300 mm, ▴), resulting in an increase in folding rate relative to control (♦). E, PDI (0.06 mg/ml) from bovine liver was added to reduced Cox19 (10 mm) to study its impact on oxidative folding (♦) relative to control (▴). Peak areas were integrated, and the % native protein (N) was plotted as a function of time in the reaction with and without PDI.

