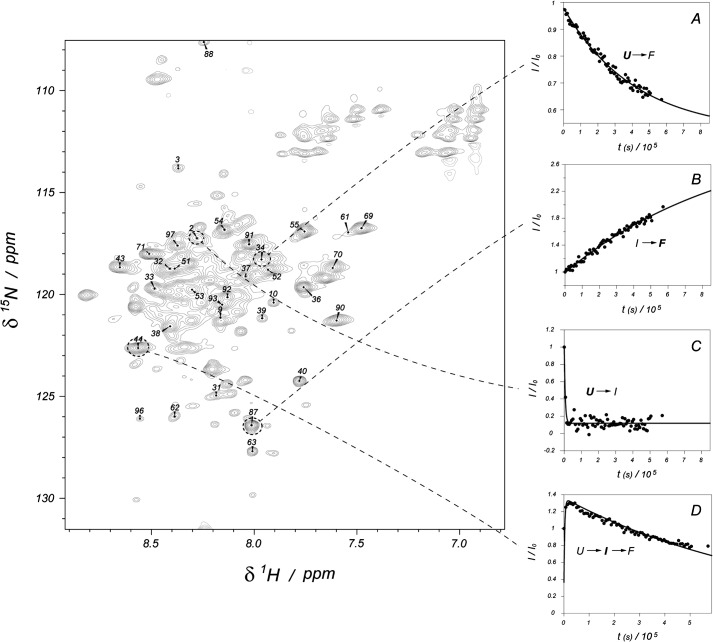
FIGURE 5.
Assignment and kinetic curves for WT Cox19. Left figure shows the partial assignment of Cox19. The plots on the right show the time evolution of representative signals for each of the four kinetic processes detected (the monitored species is marked in bold): slow unfolded state decrease toward folded conformation (A), native folded state formation (B), fast disappearance of unfolded state toward intermediate formation (C), which is coupled to the appearance of the fast intermediate and its slow evolution to the native species (D). Points represent experimental intensities, whereas lines show the least minimum square fit to the appropriate exponential equations.

