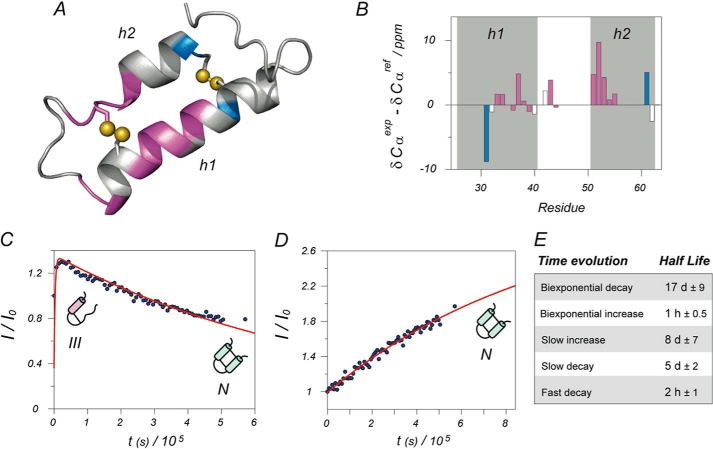
FIGURE 6.
Structural analysis and kinetic model. A, structural model of Cox19 based on homologous Cox17. Only the two structured helixes are shown; the rest of the protein is largely disordered. Assigned residues are color coded according to their kinetic evolution: purple for biexponential intermediate formation and blue for monoexponential increase of folded conformation. Most of the structured residues correspond to the intermediate state. Differences between alpha carbon chemical shifts minus reference random coil values are well known reporters of secondary structure (positive differences indicate helical structure). Structural analysis for Cox19 in the bar diagram B shows a higher helical content for helix 2 when compared with that of helix 1, suggesting that helix 2 is already formed in the intermediate. Shaded areas correspond to predicted helices according to the structural model, whereas the color code of the bars is the same as in A. Representative examples of kinetic curves for partially structured intermediate and native folded state are, respectively, shown in plots C and D, as well as schematic models for the proposed dominant species at each stage. Again, blue points represent experimental points and red lines the best least minimum square fit to the proper exponential functions. The average half-lives calculated from fits are shown in Table E.

