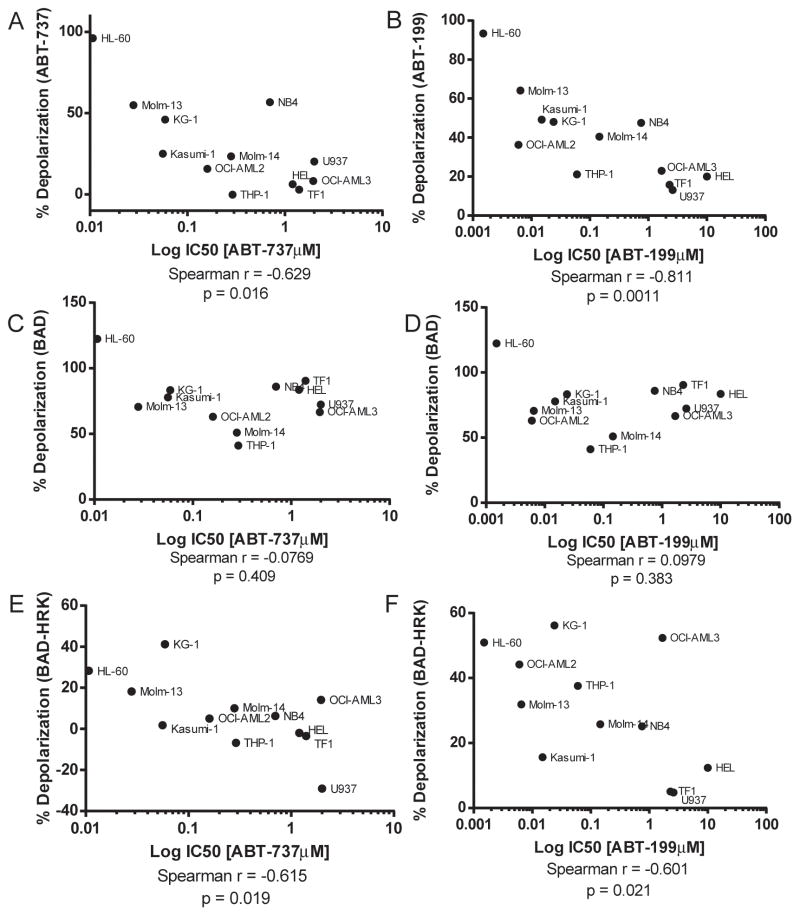
Figure 3. ABT-199 functions selectively on BCL-2 dependent mitochondria in AML cell lines.
A). The IC50 values of AML cell lines treated with ABT-737 from Figure 1A were correlated with the mitochondrial response of ABT-737 (1μM). Mitochondrial response was measured by JC1 based BH3 profiling. B). IC50 values of cell lines treated with ABT-199 from Figure 1A were correlated with the mitochondrial response of mitochondrial ABT-199 (0.1μM)C). IC50 values of AML cells treated with ABT-737 were correlated with the response to the BAD BH3 (80μM). The mitochondrial responses to the BAD BH3 peptide were measured by JC1 based BH3 profiling. D). IC50 values of AML cell treated with ABT-199 from Figure 1A were correlated with the mitochondrial response of the BAD BH3 (80uM) peptide. E). IC50 values of AML cells treated with ABT-737 were correlated with the response to the BAD BH3 (80μM) – HRK BH3 (80μM). The mitochondrial responses to the BAD and HRK BH3 peptides were measured by JC1 based BH3 profiling. F). IC50 values of AML cells treated with ABT-199 from Figure 1A were correlated with the mitochondrial response of the BAD BH3 (80uM) – HRK BH3 (80uM) peptide. Statistical correlation was performed using a one-tailed Spearman r using GraphPad Prism 6.

