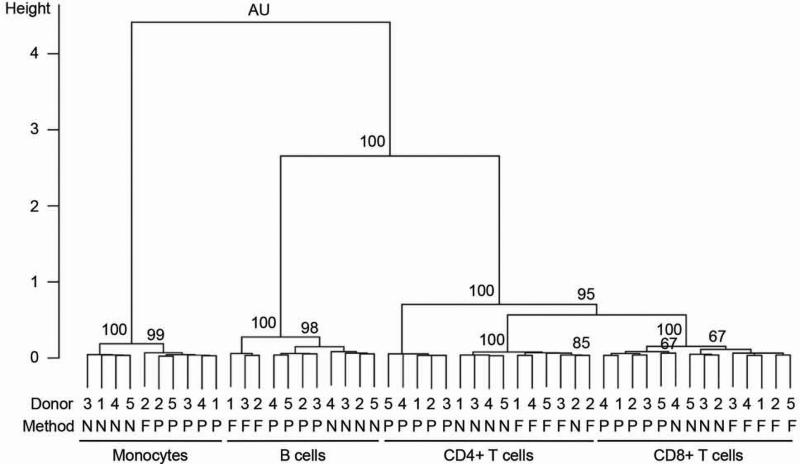
Figure 2. Unsupervised clustering of samples based on gene expression.
Unsupervised clustering performed using pvclust package in statistical computing environment R version 2.14.1 using the entire filtered gene set (N=5,843). Pearson correlation was used to measure distances between the samples. Ward's minimum variance method was used for clustering. AU refers to the approximately unbiased p-value. P-values are indicated as percentages (e.g. 95 corresponds to p<0.05). Donor ID (from 1 to 5), isolation methods and cell types are indicated. P, N and F denote positive immunomagnetic selection, negative immunomagnetic selection, and FACS, respectively.

