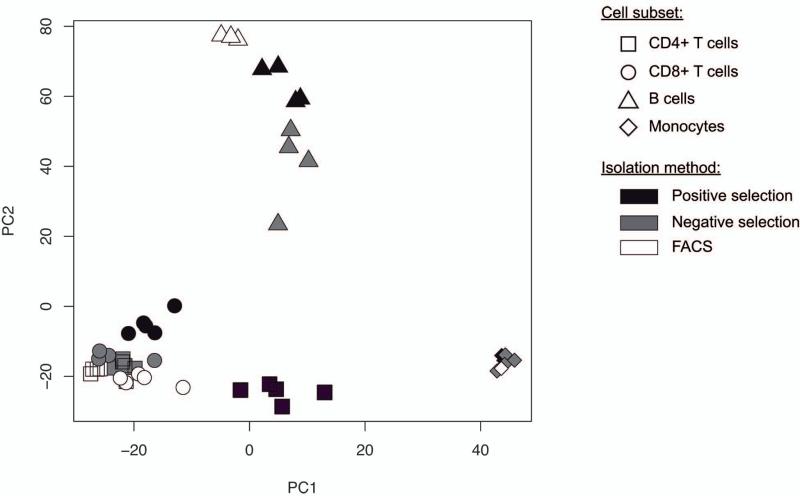
Figure 3. Principal component analysis.
Variation in gene expression summarized along the first two primary components is depicted. Information for cell type and isolation method was superimposed onto this plot. Although cell type is the major factor clustering samples along principal component 1, it is clear that cell isolation method and not donor is the signal for clustering in the 2nd component. PC1, principal component 1; PC2, principal component 2.

