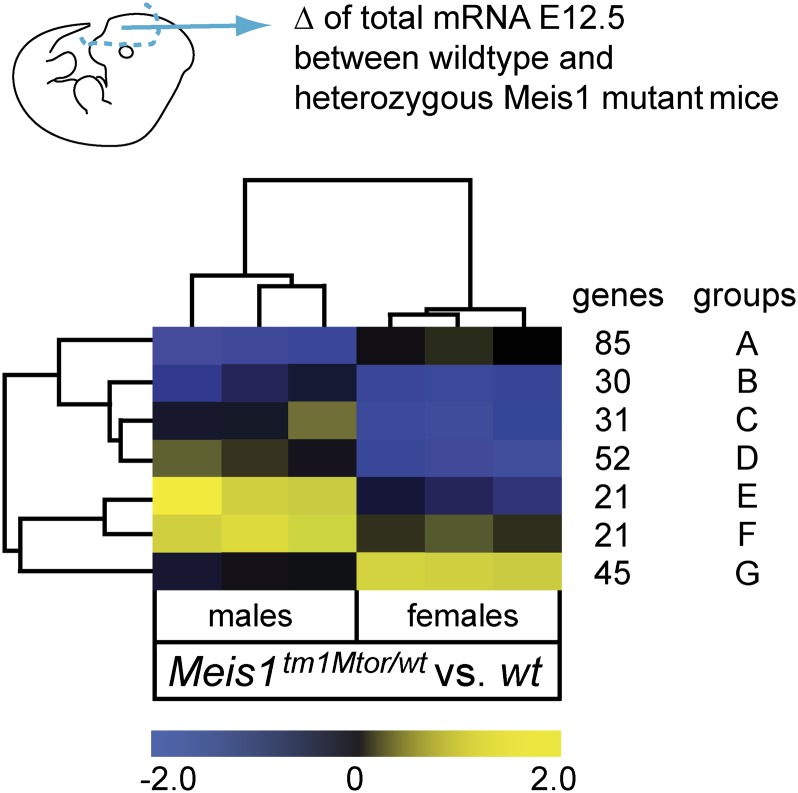
Figure 5.
MEIS1 transcriptional target genes in the E12.5 ganglionic eminences. Summarized heat map from unpaired two class analysis (SAM) of genes regulated between heterozygous Meis1tm1Mtor and wild-type forebrain tissues at E12.5. Expression profiles of male and female embryos clearly separate. Similar gene profiles are grouped together (rows) and color code gives the mean fold changes of the respective genes for each mutant embryo. Yellow represents up-regulation and blue represents down-regulation in comparison to the respective wild-type control group. The number of genes that are included in each group (A–G) with similar patterns is given. Individual genes are listed in Supplemental Table S4.

