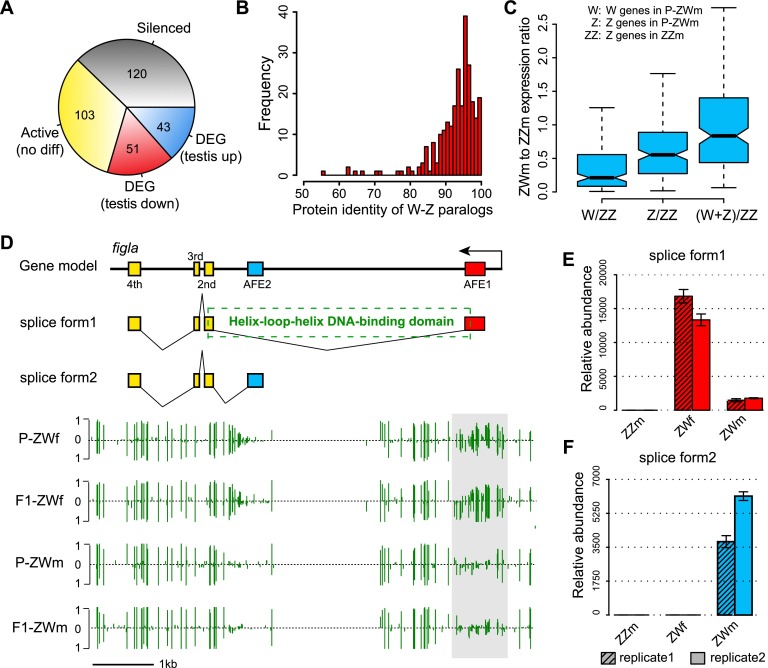
Figure 5.
W-genes expression pattern in pseudomale testes. (A) Categories of W-genes based on gene expression levels in ovaries and pseudomale testes. (B) Frequency distribution of protein identities for the 272 W-Z paralogous pairs. (C) Pseudomale to normal-male expression ratios calculated from the 272 W-genes and their Z-counterparts. From left to right: The first box represents expression ratios of P-ZWm W-genes to ZZm Z-genes; the second box represents expression ratios of P-ZWm Z-genes to ZZm Z-genes; and the third box represents expression ratios of the sum of P-ZWm W- and Z-genes to ZZm Z-genes, indicating that the expression sum of W-Z paralogous genes in pseudomale testes was close to the dosage of Z-genes in normal males. (D) Alternative splicing and methylation profile of figla. The upper section indicates the gene model and the two splice forms of figla, with the dashed box indicating the position of the basic helix–loop–helix domain, which is coded by first and second exons of splice form1. The lower section shows the DNA methylation profiles in ovaries and pseudomale testes, with the light gray box indicating the position of DMR and green vertical lines indicating methylation levels of cytosines. (E,F) Expression of the two splice forms of figla in testes of normal and pseudomales and female ovaries as determined by RT-PCR. (AFE) Alternative first exon.

