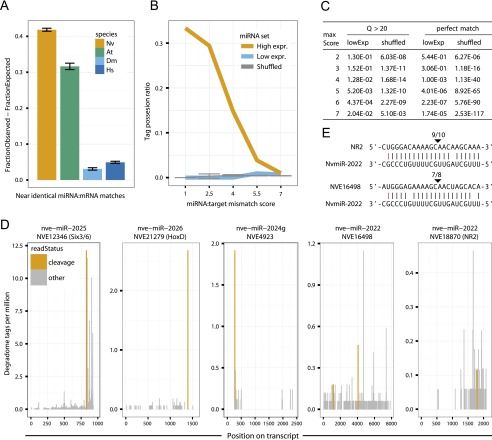
Figure 4.
Complementarity of miRNAs to Nematostella transcripts and target cleavage. (A) Distribution of miRNA:mRNA alignment mismatch scores in Nematostella vectensis, Homo sapiens, Drosophila melanogaster, and Arabidopsis thaliana, shown as the difference in abundance between miRNAs and matching shuffled miRNAs, counting the fraction of sequences in each set having a best match with score 2.5 or lower. (B) The tag possession ratio (TPR) of the 75% most expressed (high), the 25% least expressed (low), and shuffled miRNAs as a function of the alignment mismatch score. (C) Fisher’s exact tests comparing the cumulative fraction of predicted cleavage sites supported by degradome reads of the top 75% expressed miRNAs to those with lower expression (bottom 25%), and to shuffled miRNAs, at alignment mismatch score thresholds ranging from 1 to 7. (D) Examples of degradome tag density along predicted miRNA target transcripts. Tags aligning to position 10 of the miRNA are indicated in orange and tags aligning to other positions in the miRNA are in gray. (E) RLM-RACE results for the miR-2022 targets shown in panel D. Cleavage positions are indicated by arrows and ratios of positive clones are shown above.

