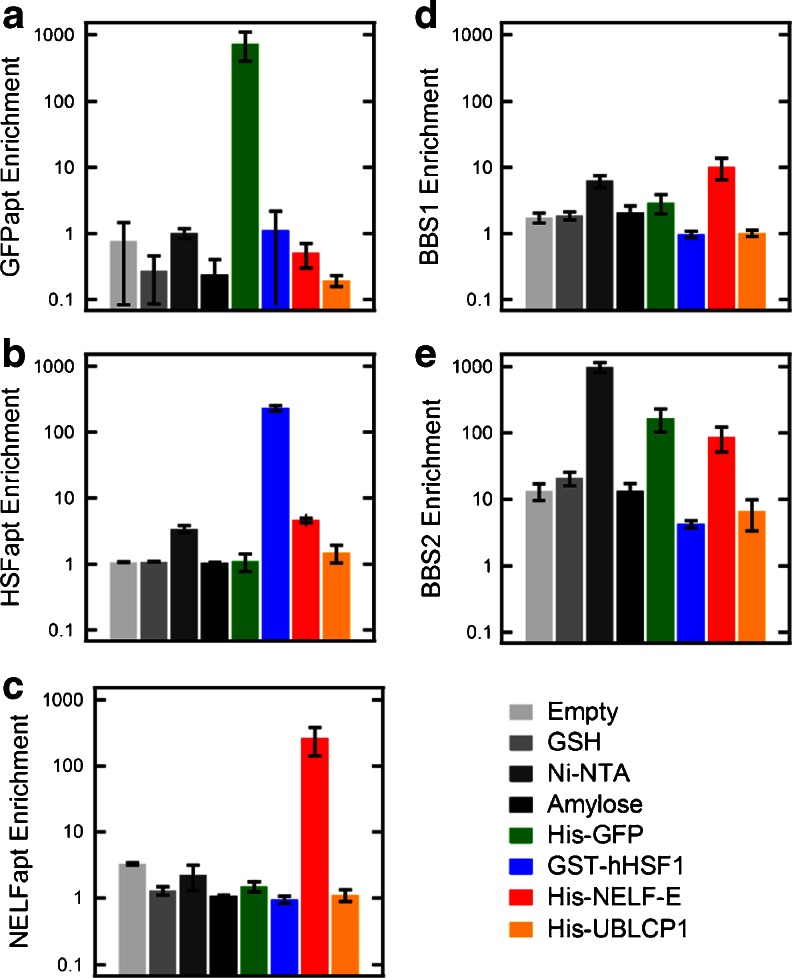
Fig. 3.
The enrichment of RNA aptamers over the N70 library on various targets connected in series. The enrichment of each protein-specific aptamer, GFPapt (a), HSFapt (b), and NELFapt (c), and non-specific aptamers, BBS1 aptamer (d), and BBS2 aptamer (e), on all eight microcolumns. The error bars represent the standard deviation in enrichments calculated for each target performed in triplicate

